
POLYNOMIAL REGRESSION [tambangEA]
- ADAPTIVE DYNAMIC CHANNEL -

MQL5 Blogs : https://www.mql5.com/en/blogs/post/770875
MT4 Version : https://www.mql5.com/en/market/product/179541
MT5 Version : https://www.mql5.com/en/market/product/179542
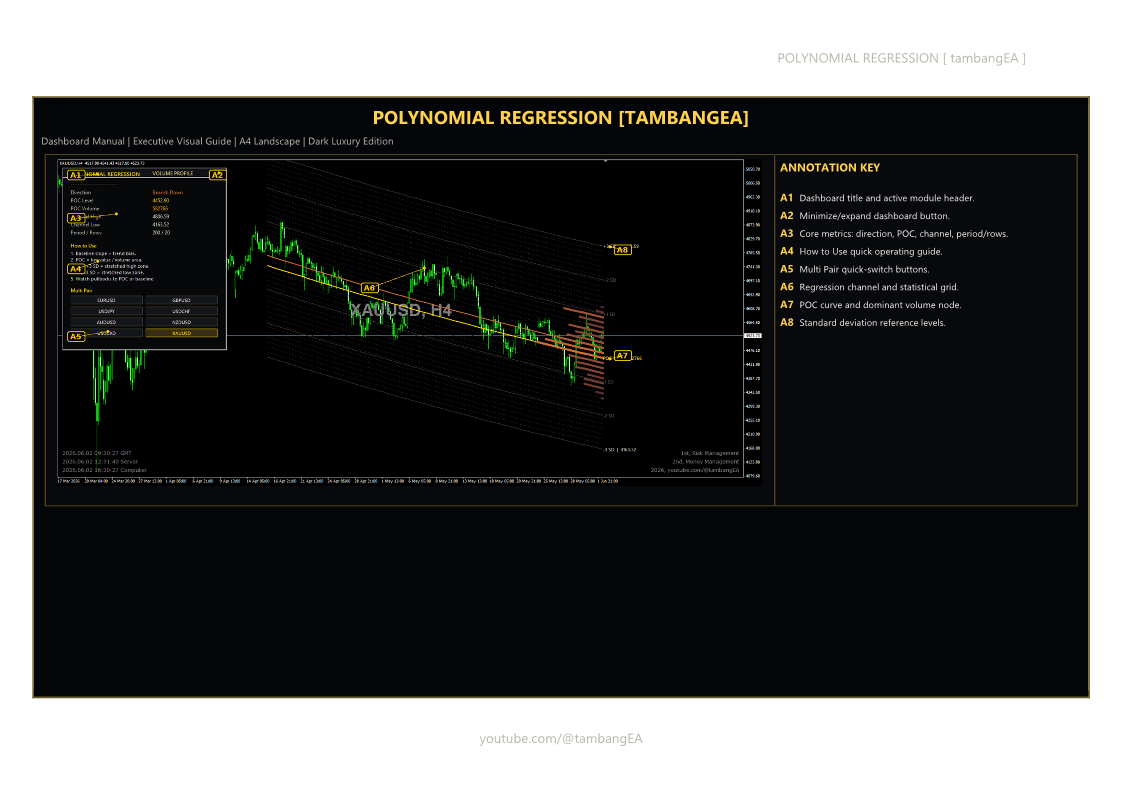
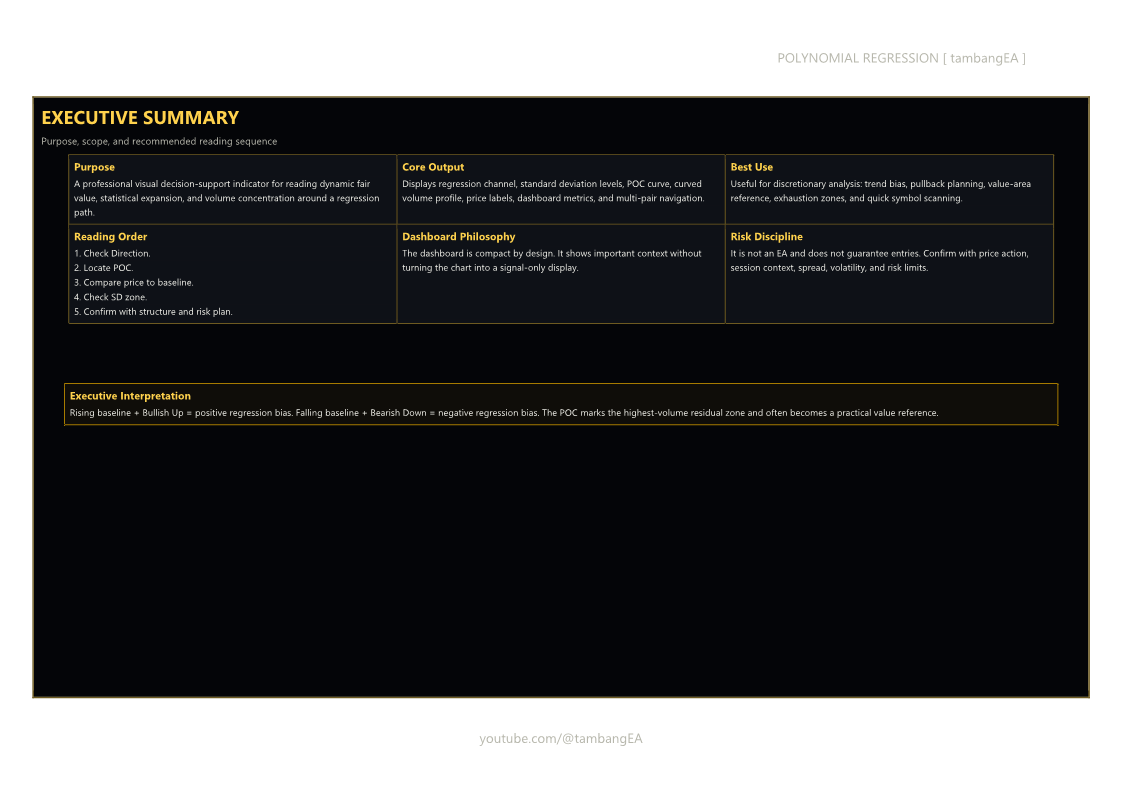
POLYNOMIAL REGRESSION [tambangEA] is designed for traders who want a clearer view of dynamic market structure, fair value movement, statistical expansion zones, and volume concentration directly on the chart.
Unlike a basic moving average or simple regression line, this indicator visualizes a complete regression matrix using a curved polynomial regression path, standard deviation zones, dynamic volume profile bars, and a Point of Control line that follows the regression structure. The result is a cleaner and more contextual way to analyze trend direction, pullback areas, stretched price zones, and high-volume reference levels.
The indicator is built as a visual decision-support tool. It does not place trades automatically and does not repaint trading signals as buy or sell arrows. Instead, it provides a professional analytical framework for discretionary traders who want to understand where price is trading relative to the regression baseline, statistical deviation bands, and volume-dominant zones.
Main Features
Polynomial / Linear Regression Channel
Choose between Linear Regression and Polynomial Regression mode. Polynomial mode provides a smoother curved structure that can adapt better to non-linear market movement.
Dynamic Regression Matrix
The indicator draws a full channel grid around the regression baseline, helping traders identify whether price is trading near fair value, premium zones, discount zones, or outer statistical extremes.
Standard Deviation Levels
The indicator displays deviation areas such as +1 SD, +2 SD, +3 SD and -1 SD, -2 SD, -3 SD. These zones help traders read market expansion, possible exhaustion areas, and statistical stretch.
Dynamic POC Line
The Point of Control is calculated from the highest-volume area relative to the regression structure. This POC line follows the regression path instead of being a simple static horizontal level.
Curved Volume Profile Visualization
Volume profile bars are projected along the regression channel, allowing traders to see where volume is concentrated within the statistical structure.
Dark Luxury Dashboard
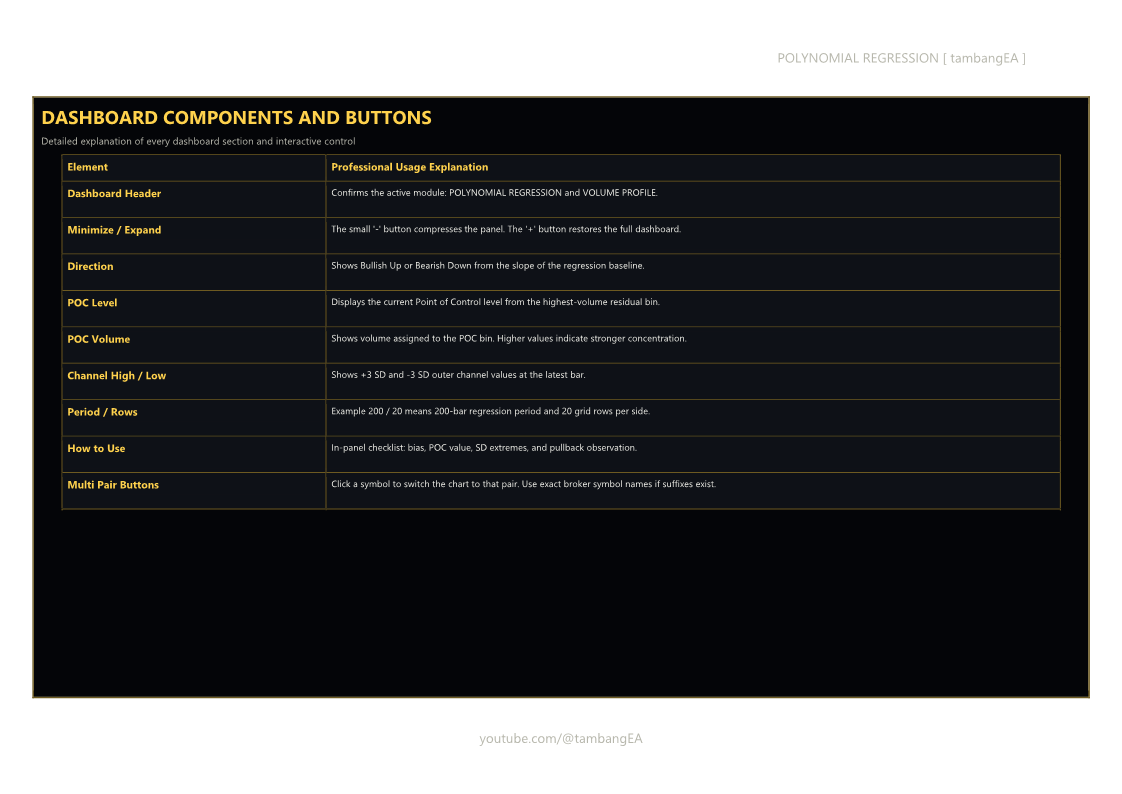
A premium dashboard displays important information clearly:
- Direction
- POC Level
- POC Volume
- Channel High
- Channel Low
- Period / Rows
- Quick usage guide
- Multi-pair quick switch panel
Multi-Pair Quick Switch
The dashboard includes clickable symbol buttons, allowing traders to switch between selected pairs directly from the chart. Broker suffixes can be customized through the input settings.
Minimize / Expand Panel
The dashboard can be minimized to save chart space and expanded again when full information is needed.
Draggable Dashboard
The dashboard can be moved on the chart for better layout control.
Performance-Oriented Object Rendering
The indicator is designed to reduce unnecessary redraws and keep the chart cleaner by updating heavy graphical objects efficiently.
How to Use
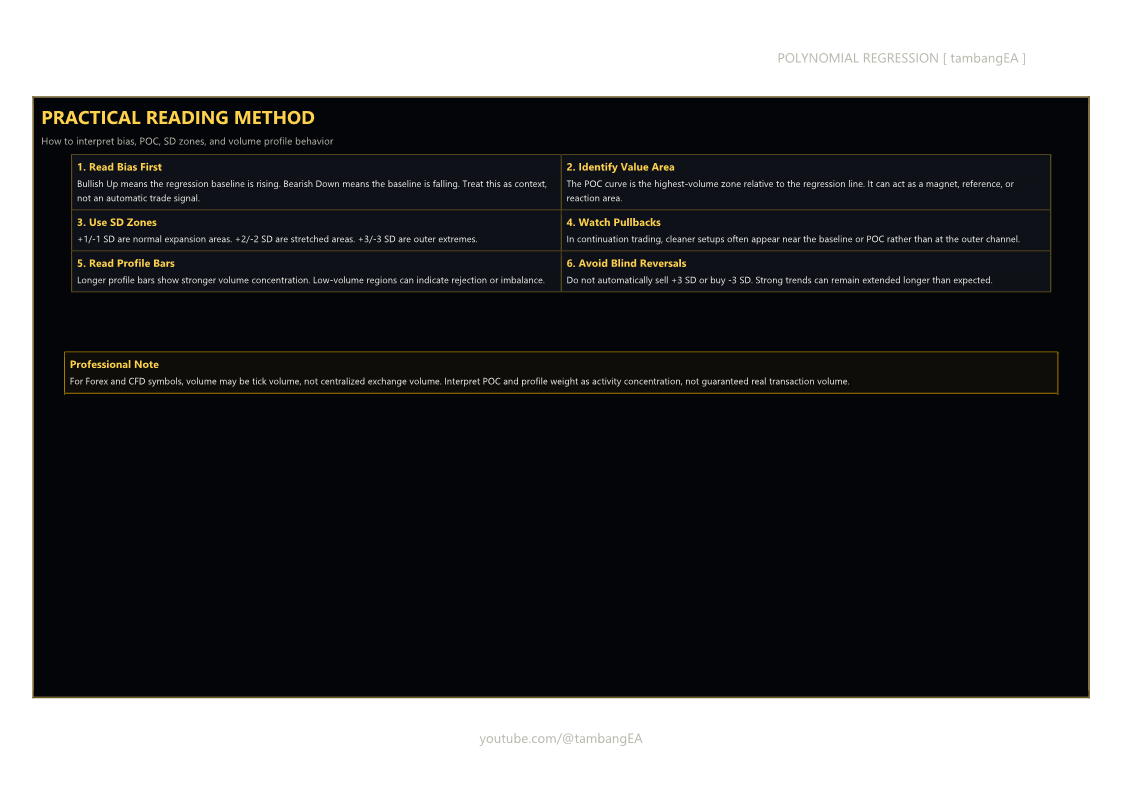
- Check the dashboard direction first.
- Bullish Up means the regression baseline is rising.
- Bearish Down means the regression baseline is falling.
- Identify the POC Level.
- The POC represents the dominant volume zone relative to the regression matrix.
- Price often reacts around this value area.
- Observe the regression baseline.
- Price near the baseline may indicate fair value.
- Price far from the baseline may indicate statistical expansion.
- Watch the standard deviation zones.
- +2 SD and +3 SD may indicate stretched upside areas.
- -2 SD and -3 SD may indicate stretched downside areas.
- Use pullbacks carefully.
- In trending markets, pullbacks toward the baseline or POC may offer cleaner decision areas than chasing price at the outer channel.
- Use Multi-Pair buttons for faster analysis.
- Add your preferred symbols in the input settings.
- Use exact broker symbol names if your broker uses suffixes such as EURUSDm, XAUUSDm, or EURUSD.pro.
Recommended Usage
This indicator is suitable for:
- Trend analysis
- Pullback analysis
- Statistical channel reading
- Volume concentration analysis
- Dynamic support and resistance reference
- Multi-pair discretionary scanning
- Market structure confirmation
It can be used on Forex, Gold, indices, commodities, and other symbols supported by your broker.
Important Notes
This indicator is not an Expert Advisor and does not execute trades automatically. It is a visual analysis tool for traders who prefer structured market reading.
The volume data used by the indicator depends on the symbol and broker. For Forex and CFD instruments, volume may represent tick volume rather than centralized exchange volume.
Input Overview
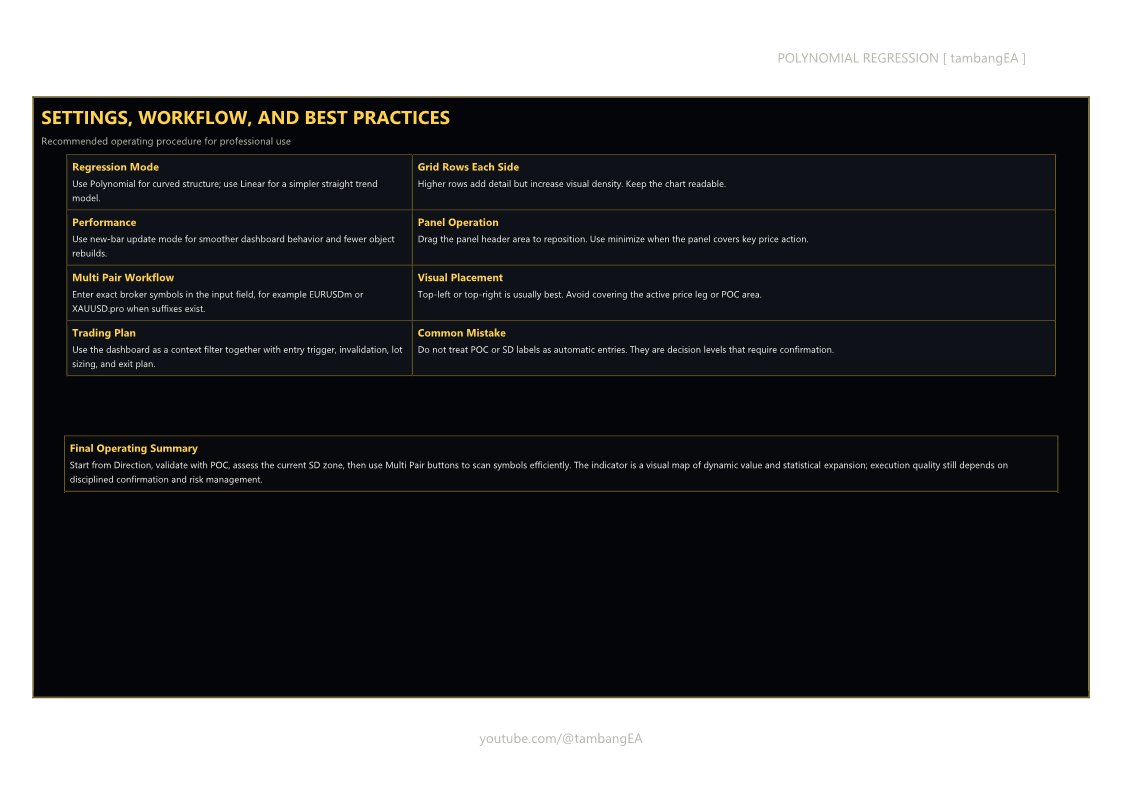
- Regression Mode: Select Linear or Polynomial mode.
- Period: Defines the regression calculation window.
- Grid Rows Each Side: Controls the number of channel rows above and below the baseline.
- POC Settings: Customize the Point of Control line.
- Standard Deviation Settings: Show or hide SD levels and adjust style.
- Volume Profile Settings: Control volume-profile visibility and width.
- Dashboard Settings: Configure panel size, position, and visibility.
- Multi Pair Settings: Add custom symbols for quick chart switching.
- Performance Settings: Reduce redraw load for smoother chart operation.
FAQ
Does this indicator open trades automatically?
No. POLYNOMIAL REGRESSION [tambangEA] is an indicator, not an Expert Advisor.
Does it give buy and sell arrows?
No. It is designed as a professional visual analysis tool, not a simple arrow signal indicator.
Can I use it for Gold or indices?
Yes, as long as the symbol is available from your broker.
Why are Multi-Pair buttons not switching correctly?
Make sure the symbol names in the input settings match your broker’s Market Watch symbols exactly. For example, some brokers use XAUUSDm instead of XAUUSD.
Is the POC horizontal?
No. The POC follows the regression structure, making it dynamic and adaptive to the current regression path.
Can the dashboard be minimized?
Yes. The dashboard includes a minimize / expand function.
Can the dashboard be moved?
Yes. The panel can be dragged to a more convenient chart position.
SEO Keywords
Polynomial Regression indicator, regression channel, volume profile indicator, POC indicator, dynamic POC, standard deviation channel, statistical trading indicator, forex regression indicator, gold trading indicator, XAUUSD indicator, market structure indicator, regression matrix, trading dashboard, tambangEA, MQL5 indicator, MetaTrader 5 indicator, MT5 regression indicator, professional trading tool.
Risk Disclaimer
Trading involves risk. This indicator does not guarantee profit and should not be used as the sole basis for trading decisions. Always apply proper risk management, use stop-loss planning, and test any trading approach carefully before using it on a live account.


