
Manage Tab(Recovery and Breakeven)
Recovery (Manage Sub-Tab)
The fourth sub-tab of the Manage tab is Recovery (Recovery Zone Strategy).
What is Recovery Zone?
RecoveryZone in this dashboard creates a channel of Buy and Sell orders:
Buy orders are always placed at the top line of the channel
Sell orders are always placed at the bottom line of the channel
How it works:
First order is a Buy at the top line
If price goes down into loss, you open a Sell at the bottom line (with a larger lot size)
Now you have one Buy and one Sell. If price goes down, the Sell makes more profit than the Buy's loss → total profit
If price goes back up, you open a second Buy at the top line
If price goes up, you make profit. If it goes down again, you open another Sell
This continues until price spikes out of the channel and all orders close at a profit
This strategy creates a hedging effect where opposing positions work together to achieve overall profit.
⚠️ Warning: This is a complex hedging strategy that requires careful risk management. It can tie up significant margin and may lead to large drawdowns if the market moves in a strong trend without reversing.
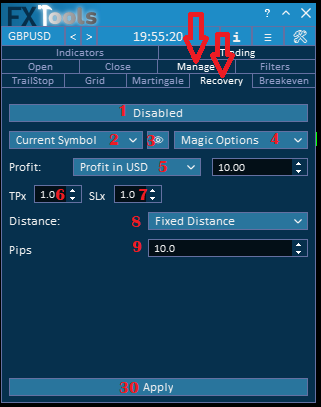
1. Disabled / Enabled Button
Disabled – The Recovery Zone strategy will not work.
Enabled – The Recovery Zone strategy will work based on the settings you configure below.
________________________________________
2. Symbol Dropdown
Use this dropdown to choose which market symbols you want the Recovery Zone strategy to apply to.
All Symbols – Recovery Zone will apply to every symbol in your account.
Specific Symbol – Recovery Zone will apply only to that one symbol.
________________________________________
3. Show Future Recovery Zone Levels (Eye Button)
This button looks like an eye 👁️.
When clicked, it shows future Recovery Zone levels on the chart for the symbol and trades you selected (via items 2 and 4).
The displayed levels depend on your Recovery Zone settings and show you exactly where the next Recovery Zone trade will open.
________________________________________
4. Magic Number Filter
This menu lets you select which Magic Numbers should be included for the Recovery Zone strategy.
You can select multiple options at the same time.
________________________________________
5. Profit – Target Profit for the Basket
Here you set how much total profit you want to achieve from all Recovery Zone orders in the same basket before they are closed.
You have two options for the profit type:
You enter the actual value in the box (item 6 in the picture).
________________________________________
7. TP – Where to Close the Orders
Here you set where the dashboard should close all Recovery Zone orders. The system will automatically adjust the lot sizes so that when all orders close at this price, you achieve the exact profit you entered in item 5.
________________________________________
8. Distance – Recovery Zone Order Spacing
This setting determines the distance between each Recovery Zone order (the channel width between top and bottom lines).
Different options are available. When you select an option, additional settings appear below it.
Magic Number Options Table
||DSML||Profit Type Options Table
| Option | Meaning |
|---|---|
| (1) All Magics (default) | Includes every trade (manual trades, all EAs, and every trade type) |
| (2) FXtools Orders | Only considers trades opened using the FXtools Dashboard |
| (3) All Bots Orders | Only considers trades from all Bots (EAs). Excludes manual trades |
| (4) Manual Orders | Only considers manually opened orders |
| Type | Meaning |
|---|---|
| USD | A fixed currency amount (e.g., 10 USD) |
| Percentage (%) | A percentage of your account balance (e.g., 10%) |
TP Options Table
| Option | Meaning |
|---|---|
| (1) Initial TP | Orders will close when all Recovery Zone orders reach the main initial order's TP level. |
| (2) Last Line | Orders will close when the price reaches the open price of the last order. |
| (3) Distance % of Last Open | Orders will close at a percentage of the distance between the last open price and its previous order. A box appears where you enter the percentage value. |
| (4) Average | Sets the TP at the average of all TP levels of the Recovery Zone orders in the basket. |
9. Option 1 – Fixed Distance
9. Option 1 – Fixed Distance
When you select Fixed Distance, you set the Recovery Zone channel to have a fixed distance between the top and bottom lines.
Pips: You adjust the fixed distance by entering a value in pips (e.g., 20 means 20 pips between each Recovery Zone order level).
________________________________________
If you have already enabled Recovery Zone and want to change your settings:
Modify the values you wish to change
Click the Apply button
The new settings will be applied immediately.
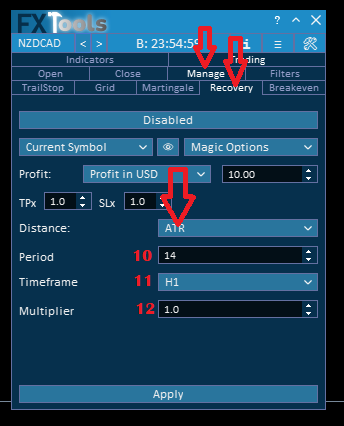
Option 2 – ATR (Average True Range)
Option 2 – ATR (Average True Range)
The second option is ATR. The distance between Recovery Zone orders is calculated based on the ATR indicator value (volatility-based channel width).
When you select this option, 3 more options appear:
Setting Meaning 10. Period The period of the ATR indicator (e.g., 14 for 14 bars) 11. Timeframe The timeframe on which the ATR is calculated (e.g., H1, M15) 12. Multiplier The multiplier of the ATR value. Example: 2 = 2x ATR, 0.5 = half the ATR value
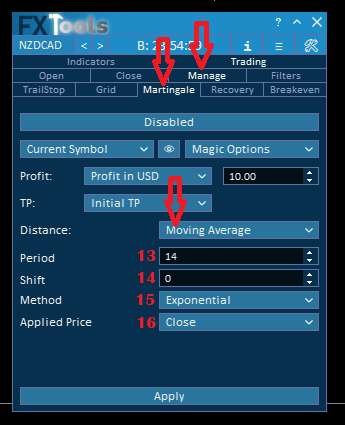
Option 3 – Moving Average (MA)
Option 3 – Moving Average (MA)
The third option is Moving Average. The distance between Recovery Zone orders is calculated based on the MA indicator value.
When you select this option, 5 more options appear:
Setting Meaning 13. Period The period of the MA indicator 14. Shift The shift of the MA (move forward or backward) 15. Timeframe The timeframe on which the MA is calculated 16. Method The MA method (SMA, EMA, SMMA, LWMA) 17. Applied Price The price type used for MA calculation (Close, Open, High, Low, etc.)
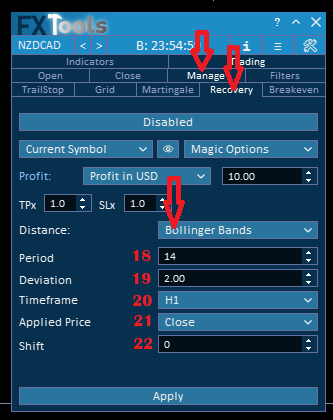
Option 4 – Bollinger Bands (BB)
Option 4 – Bollinger Bands (BB)
The fourth option is Bollinger Bands. The distance between Recovery Zone orders is calculated based on the distance from the current lower or upper band (whichever is closest) to the open price of the previous order.
When you select this option, 5 more options appear:
Setting Meaning 18. Period The period of the Bollinger Bands indicator 19. Deviation The standard deviation multiplier (typically 2) 20. Timeframe The timeframe on which the BB is calculated 21. Applied Price The price type used for BB calculation 22. Shift The shift of the BB indicator
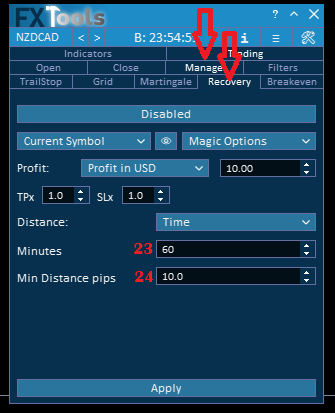
Option 5 – Time
Option 5 – Time
The fifth option is Time. The distance between Recovery Zone orders is based on time intervals, regardless of price movement.
Example: Every 30 minutes, a new Recovery Zone order opens automatically.
Setting Meaning 23. Minutes The time interval in minutes between each Recovery Zone order 24. Min Distance Pips The minimum price distance required between the current order and the previous order. If price hasn't moved enough, the time-based order will not open.
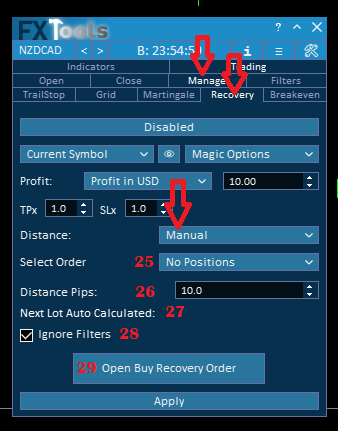
Option 6 – Manual
Option 6 – Manual
The sixth option is Manual. This means instead of automatic opening, you must manually click a button to open the next Recovery Zone order.
The lot size of the next order will be automatically calculated based on your settings.
________________________________________
25. Select Order
Here you select one of the existing Recovery Zone orders. The next order will be based on the one you select.
________________________________________
26. Distance Pips
The minimum distance required between the last order and the new order (in pips).
________________________________________
27. Next Lot Auto Calculated
When an order is selected, this field shows the automatically calculated lot size for the next Recovery Zone order.
________________________________________
28. Ignore Filters
If this checkbox is selected, the system will ignore all filters inside the Filter tab and open the order regardless.
________________________________________
29. Open Buy/Sell Recovery Order Button
This button opens the next order.
The order type (Buy or Sell) will be determined automatically based on the order you selected from the dropdown menu (item 25).
Breakeven (Manage Sub-Tab)
The fifth sub-tab of the Manage tab is Breakeven.
What is Breakeven?
Breakeven in this dashboard means moving the Stop Loss of an order to the open price of that order. This makes the trade risk-free because even if the Stop Loss is hit, you will lose no money (you break even).
How it works:
You open a trade with a Stop Loss
The price moves in your favor by a certain amount
The dashboard automatically moves the Stop Loss from its original position to the open price
Now, if price reverses and hits the Stop Loss, you close the trade at zero profit / zero loss
This is a popular risk management tool that protects your capital once a trade shows promise.
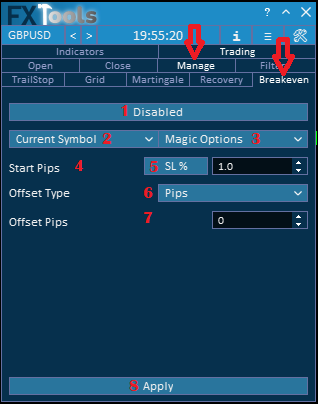
1. Disabled / Enabled Button
Disabled – Breakeven will not work.
Enabled – Breakeven will work based on the settings you configure below.
________________________________________
2. Symbol Dropdown
Use this dropdown to choose which market symbols you want the Breakeven strategy to apply to.
All Symbols – Breakeven will apply to every symbol in your account.
Specific Symbol – Breakeven will apply only to that one symbol.
________________________________________
3. Magic Number Filter
This menu lets you select which Magic Numbers should be included for Breakeven.
You can select multiple options at the same time.
________________________________________
4. Start Pips
This setting determines after how many pips of profit the Stop Loss should be moved to the open price.
Example: If you set 10, when the trade reaches 10 pips in profit, the dashboard will move the SL to the open price.
________________________________________
5. Start Pips Calculation Type
Here you choose how the Start Pips value is calculated. You select the type, and the box next to it is where you enter the value.
________________________________________
6. Offset Type
Sometimes you may want the new Stop Loss to be placed slightly beyond the open price (on the profit side) rather than exactly at the open price. This is called an offset.
An offset ensures that even after accounting for spread and commissions, you don't close at a small loss.
Magic Number Options Table
| Option | Meaning |
|---|---|
| (1) All Magics (default) | Includes every trade (manual trades, all EAs, and every trade type) |
| (2) FXtools Orders | Only considers trades opened using the FXtools Dashboard |
| (3) All Bots Orders | Only considers trades from all Bots (EAs). Excludes manual trades |
| (4) Manual Orders | Only considers manually opened orders |
Start Pips Calculation Type Table
| Option | Meaning | Example |
|---|---|---|
| (1) SL % | Percentage of the original Stop Loss distance | If SL = 100 pips and you set 5, breakeven activates after 5 pips (5% of 100) |
| (2) TP % | Percentage of the original Take Profit distance | If TP = 200 pips and you set 10, breakeven activates after 20 pips (10% of 200) |
| (3) Price % | Percentage of the current price | If price = 1.10000 and you set 1, breakeven activates after 0.01100 (110 pips) |
| (4) Pips | Fixed number of pips (simple and direct) | If you set 15, breakeven activates after 15 pips of profit |
Offset Type Table
| Option | Meaning |
|---|---|
| Pips | You enter a fixed number of pips for the offset. The SL will be placed that many pips beyond the open price into profit. |
| Commission + Spread | The dashboard automatically calculates the spread and commission costs. The SL is placed so that when the trade closes, your net profit/loss is exactly zero (accounting for all costs). |


