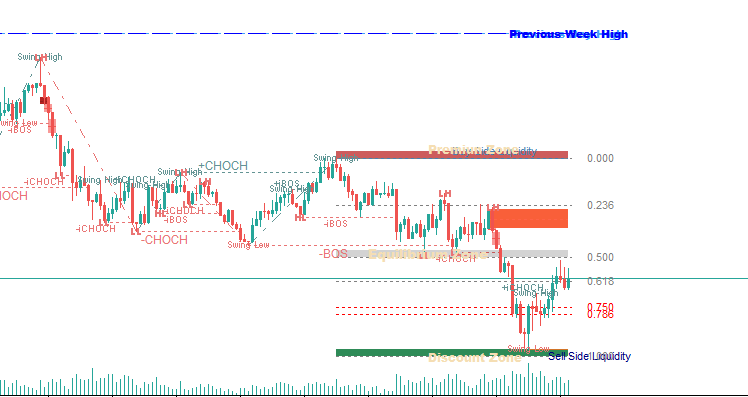
LEARNING TO USE THE ICT-SMC CONCEPTS INDICATOR – PART 6: EQUALS - CISD - OTE
Equal low y Equal high
Equals are price structures that form when two highs or two lows have virtually the same value. These zones are often interpreted as areas of liquidity or potential manipulation points in analysis based on the ICT (Inner Circle Trader) model.
- Equal High (EQH): Two highs with similar prices.

- Equal Low (EQL): Two lows with similar prices.

Parameters related to Equal Highs and Equal Lows:
- "Choose the mode for the difference between swings: ": This parameter defines how the minimum allowed difference margin, in points or atr (using a multiplier), between two highs or lows is calculated so that they can be considered "equal".
- "Atr multiplier or distance in points": Value to calculate the minimum allowable margin. If the "Choose the mode for the difference between swings:" parameter is "By Atr," the atr multiplier must be entered; otherwise, the minimum distance in points must be entered.
- Since it's unlikely that two candles will have exactly the same high or low, this parameter creates a range around the first detected point. The configured value is added and subtracted from that first price, thus generating a tolerance interval.
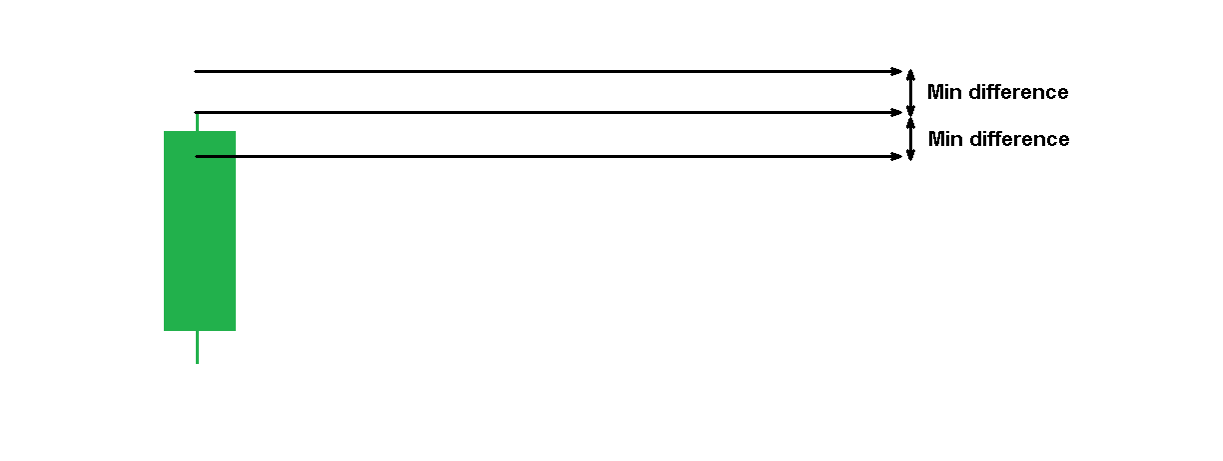
As seen in the image, a range is generated; if the second high (or low) falls within that range, it is considered that there is an Equal High (EQH) or Equal Low (EQL), respectively.
-
choose the color of the equal high (text and line):
Choose the color of the text and the line that will mark the equal height. -
choose the color of the equal low (text and line):
Choose the color of the text and the line that will mark the equal low. -
Line Style Equals:
Line style for equals. See post: Types of lines in MT5.
CIDS
The CISD concept comes from the ICT approach and represents a structure that combines:
- A liquidity sweep over an important area (significant highs or lows).
- A subsequent impulsive breakout from the candle that generated said sweep.
This pattern allows you to identify potential points of manipulation and changes in price direction.

Cisd Configuration:
- bullish cisd color: Choose the color to represent a bullish CISD.
- bearish cisd color: Choose the color to represent a bearish CISD.
- swing collection period. this to identify liquidity zones: This parameter defines the number of candles required to identify a swing. These swings are used by the indicator to mark high or low areas that could be manipulated. For more information on how swings are identified, see the following post:
https://www.mql5.com/en/blogs/post/762662 - number of candles to find the beginning of the cisd impulse (in candles): Defines how many backward candles will be analyzed to find the start of the impulse that generated the liquidity sweep.
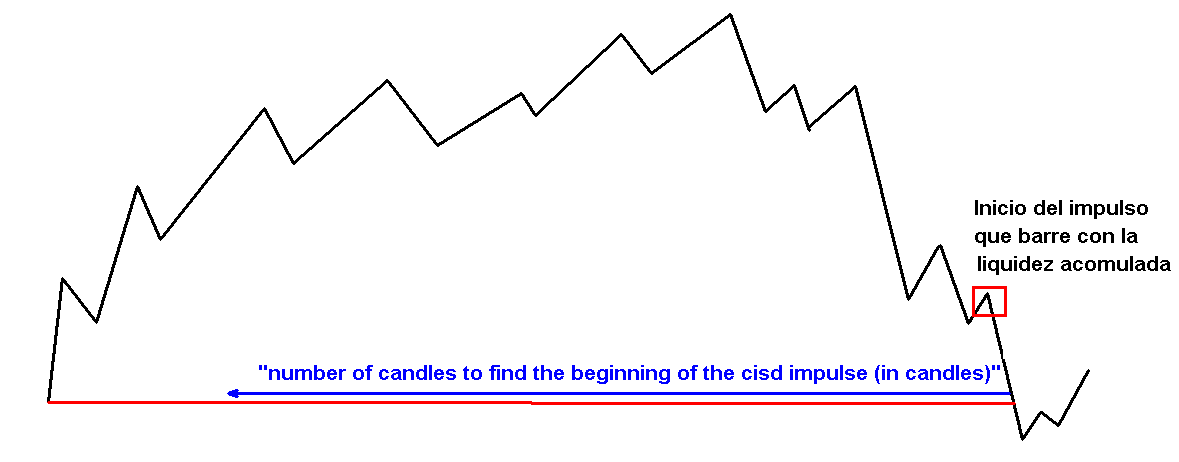
As seen in the image, the parameter "number of candles to find the beginning of the CISD impulse (in candles)" indicates the number of candles that will be used to find the beginning of the impulse that started with this liquidity sweep.
The lower this value, the greater the probability that the CISD will appear earlier. However, this can reduce the reliability of the breakout as a trend continuation.
Values greater than 20 do not make a noticeable difference. It is recommended to maintain a range between 15 and 20 for balanced results.
- maximum wait for taking liquidity from a swing (in candles): This parameter defines the maximum number of candles the indicator will wait for manipulation to occur on a previously identified swing. It is recommended that you also increase this parameter proportionally as you increase the value of the "number of candles to find the beginning of the cisd impulse (in candles)" parameter. A rule of thumb is to set this value between three and four times the value of the previous parameter to ensure an adequate detection margin.
- Maxima waits in candles: This value represents the maximum wait allowed (in number of candles) for a full-bodied close to occur above or below the point that originated the movement (liquidity sweep).
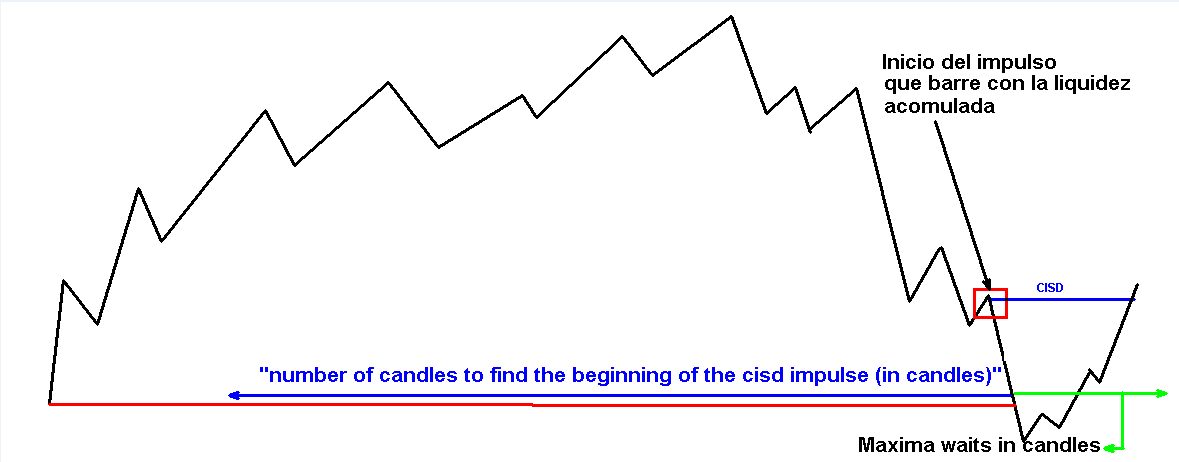
In the example image, the green line represents the tolerance band within which the candle must close for the CISD to be valid.
- If the value of this parameter is high, greater tolerance will be granted, allowing more flexibility for the closure to occur.
- Conversely, a low value will reduce that tolerance, making the condition stricter and therefore more difficult to detect a CISD.
OTE:
The OTE (Optimal Trade Entry) is a concept within the ICT model that helps identify optimal entry zones. Its graphical representation is similar to the Fibonacci retracement, but with certain adjustments at key levels.
The most important level within the OTE is 0.750, considered the ideal point for executing a high-probability entry.
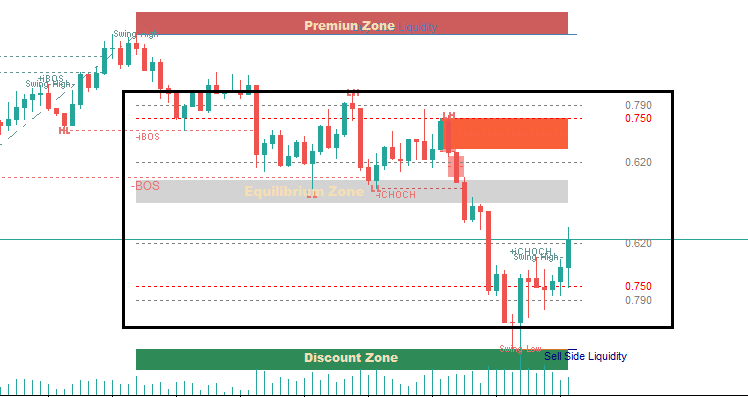
Parámetros generales del OTE:
- Ote Line Style: Select the line style that will be used to plot the OTE levels. See the post: Types of lines in MT5.
- Ote main line color: Defines the color of the OTE's key level. For example, in the previous image, this level was represented by a red line.
- Ote secondary line color: Color to be used for the secondary levels of the OTE. In the reference image, these levels are gray.
- Extension of the ote line (candles): Sets the number of candles used to extend the OTE lines. By default, this value is usually 1.
- Ote levels separated by ",": Defines the OTE levels to be drawn. These should be entered as a comma-separated list. Rules:
- Comma separation:
All levels must be separated by commas, without spaces.
Correct example: "0.790,0.750,0.62"
- Key level marking:
To help the indicator identify the primary OTE level, the desired value must be preceded by the "&" symbol.
Example: "0.62,0.75,&0.80"
In this case, level 0.80 will be considered the key level.
Additionally, multiple key levels can be marked by adding the "&" symbol to each one you want to highlight.
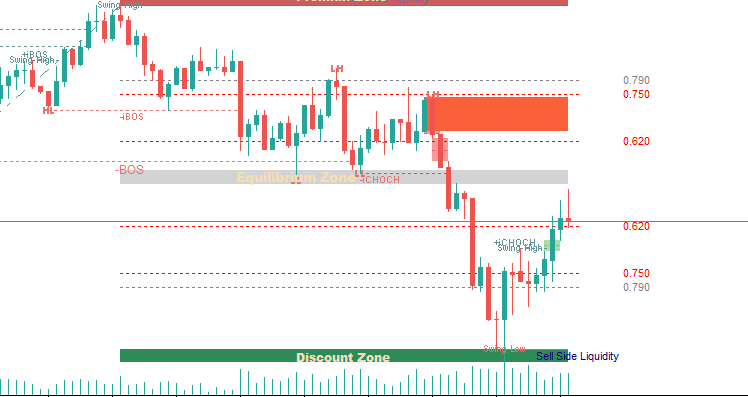
Example with 2 key levels. ("Ote levels separated by "," " = "0.790,&0.750,&0.62")
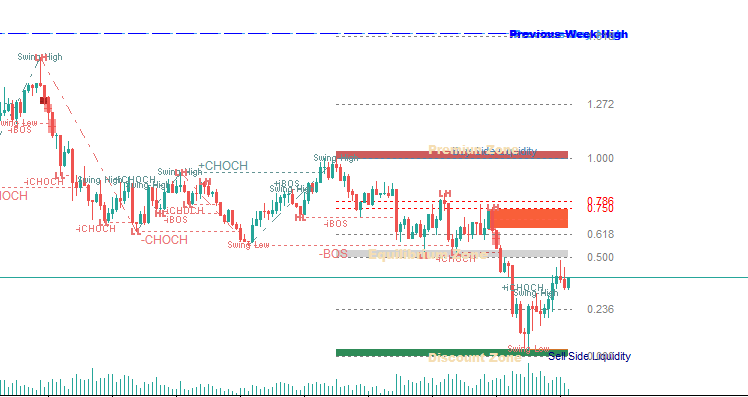
Fibonacci example. ("Ote levels separated by "," " = "0.0,0.236,0.50,0.618,&0.750,&0.786,1.00,1.272,1.618,2.618,4.236")
Sell:
Buy:
