Introduction
Optimus Time Tracker Indicator
Welcome to the user manual for Optimus Time Tracker V1.00, a custom indicator for MetaTrader 5 (MT5) developed in MQL5. This indicator analyzes historical price data to provide statistical insights into market behavior across different timeframes and trading sessions. It offers three analysis modes: Weekly High & Low Stats, Bullish vs. Bearish Close, and High and Low by Session. The indicator features a user-friendly control panel for customizing settings and a toggle button to show or hide the display.
Purpose
The Optimus Time Tracker V1.00 helps traders identify patterns in price movements by displaying:
- The frequency of weekly highs and lows occurring on specific days.
- The percentage of bullish (close > open) versus bearish (close < open) daily closes.
- The distribution of daily highs and lows across four trading sessions (Asian, European, Overlap, US)
Audience
This manual is intended for:
- Beginner traders new to MetaTrader 5 who want to use technical indicators.
- Intermediate traders familiar with MT5 and MQL5, looking to customize and interpret the indicator’s output.
- Advanced users who need detailed configuration options for specific trading strategies.
Parameters
Features and Configuration
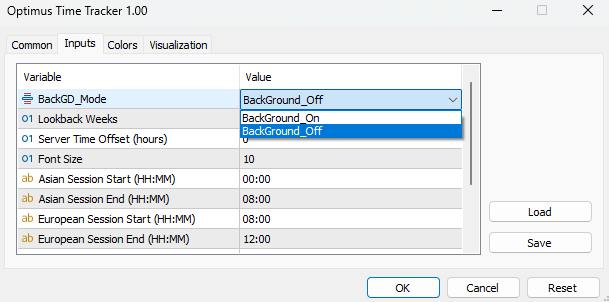
Input When adding the indicator to a chart, you can configure the following settings in the input dialog:
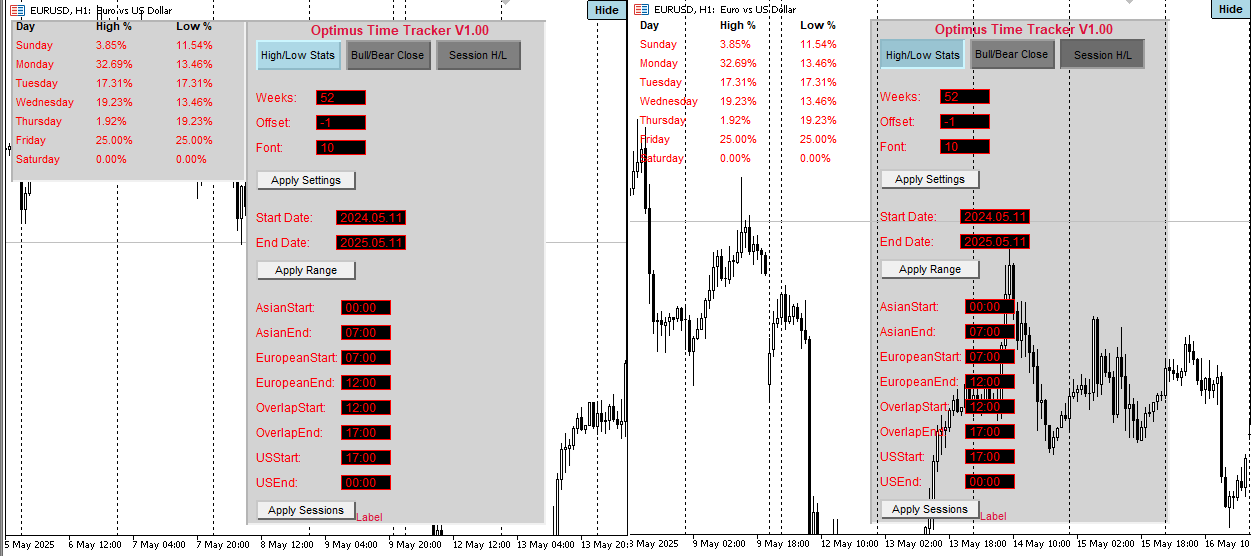
Background Transparency (BackGD_Mode):
- Options: BackGround_On (default: Off), BackGround_Off.
- Enables or disables a light gray background for the statistics tables and control panel.
Lookback Weeks (InpLookbackWeeks):
- · Default: 52 weeks.
- · Specifies the number of weeks of historical data to analyze (must be positive).
- · Example: Set to 26 for a 6-month analysis.
Server Time Offset (InpServerTimeOffset):
- Default: 0 hours.
- Adjusts the server time to align with your local timezone (in hours, e.g., -3 for a 3-hour offset).
Font Size (InpFontSize):
- Default: 10.
- Sets the font size for the GUI (range: 6–20).
Session Times:
- Define start and end times for four trading sessions in HH:MM format (24-hour clock).
- Defaults:
- Asian Session: 00:00 to 08:00.
- European Session: 08:00 to 12:00.
- Overlap Session: 12:00 to 16:00.
- US Session: 16:00 to 00:00.
- Ensure times are non-overlapping and valid (e.g., 08:30 is valid, 25:00 is not)
Analysis Modes
The indicator offers three modes, accessible via navigation buttons in the control panel:
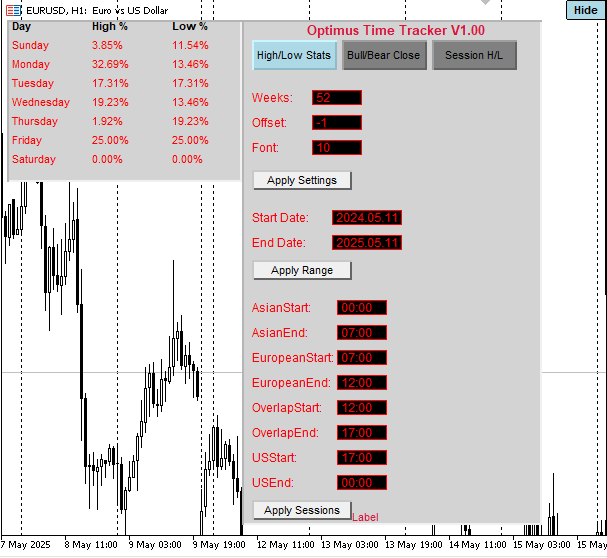
1. Weekly High & Low Stats (MODE_HIGH_LOW):
- Displays the percentage of weeks where each day (Sunday–Saturday) had the highest or lowest price.
- Example: “Monday High %: 20.5%” means Monday was the weekly high in 20.5% of analyzed weeks.
- Useful for identifying days with significant price movements.
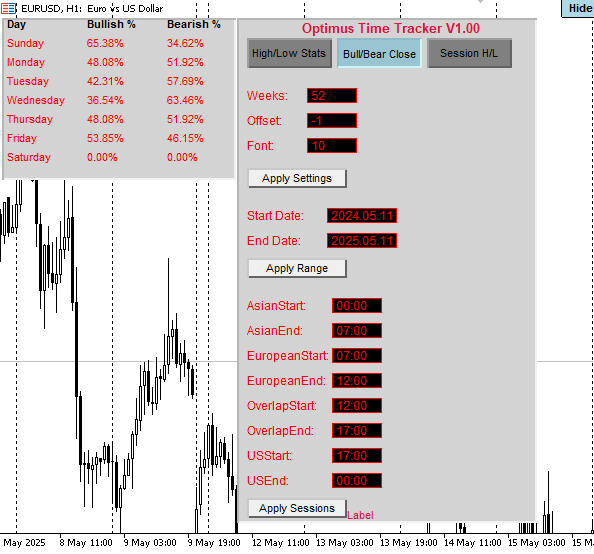
2. Bullish vs. Bearish Close (MODE_BULL_BEAR):
- Shows the percentage of days with a bullish (close > open) or bearish (close < open) close for each day of the week.
- Example: “Tuesday Bullish %: 55.0%” means 55% of Tuesdays closed higher than they opened.
- Helps assess directional bias by day.
3. High and Low by Session (MODE_SESSION):
- Analyzes the percentage of daily highs and lows occurring in each session (Asian, European, Overlap, US) for each day.
- Displays four separate tables, one per session.
- Example: “Asian Wednesday High %: 30.0%” means 30% of Wednesdays had their daily high during the Asian session. · Ideal for session-based trading strategies.
Control Panel
The control panel, located on the right side of the chart, allows real-time configuration:
Navigation Buttons:
- High/Low Stats, Bull/Bear Close, Session H/L:Switch between analysis modes.
- The active mode’s button is highlighted in light blue.
Common Settings:
- Weeks: Adjust the lookback period (e.g., enter 26 for 26 weeks).
- Offset: Set the server time offset (e.g., -3 for a 3-hour offset).
- Font: Change the font size (6–20).
- Click Apply Settings to update these parameters.
Custom Range:
- Start Date, End Date: Enter dates in YYYY.MM.DD format (e.g., 2024.01.01).
- Allows analysis of a specific date range instead of the default lookback weeks.
- Click Apply Range to process the custom range.
- Note: End date must be after start date and not in the future.
Session Times:
- Fields for Asian, European, Overlap, and US session start/end times (e.g., 08:00).
- Click Apply Sessions to update session definitions.
- Ensure times are valid and non-overlapping.
Error Label:
- Displays error messages (e.g., “Invalid session time format”) at the bottom of the panel in red.
Visibility Toggle Button
- Located in the top-right corner of the chart.
- Labeled Hide (when visible) or Show (when hidden).
- Click to toggle the visibility of the control panel and statistics tables.
- Useful for decluttering the chart while keeping the indicator active.
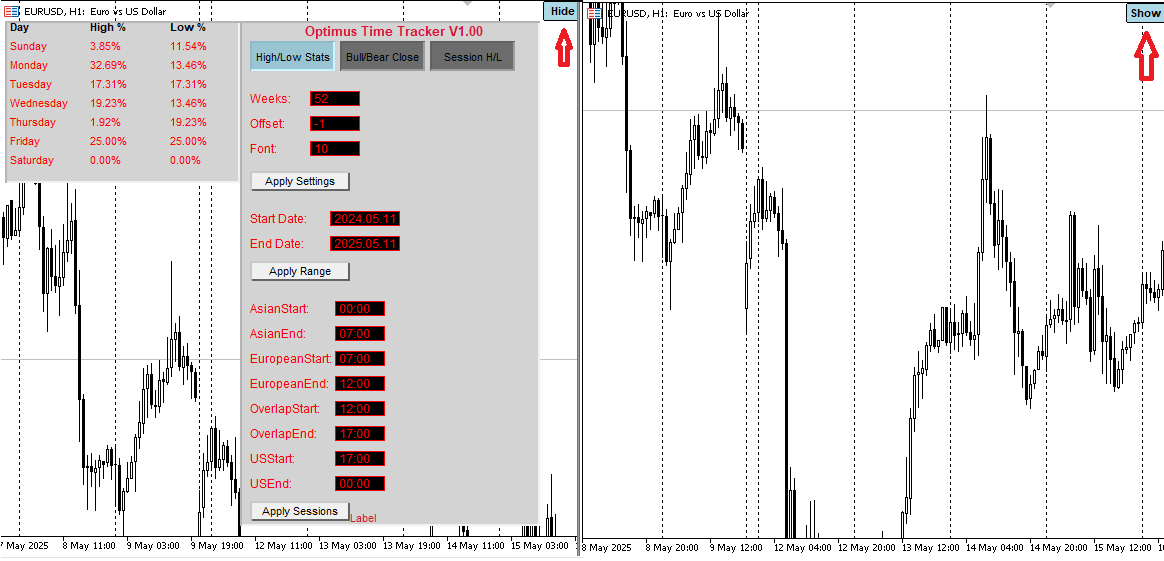
Data Persistence
- Settings (lookback weeks, offset, font size, session times, custom range) are saved to a file named Optimus_Time_Tracker_User_settings.txt in the MT5 common data folder (MQL5\Files in the common directory).
- On initialization, the indicator loads saved settings, overriding default inputs if the file exists.
- Changes made via the control panel are automatically saved when applying settings, ranges, or sessions.
Usage Instructions
Starting the Indicator
1. Add the indicator to a chart.
2. The control panel and a statistics table (default: High/Low Stats) will appear on the chart.
3. Verify that data is displayed. If not, ensure sufficient historical data is available.
Switching Analysis Modes
1. In the control panel, click one of the navigation buttons:
- · High/Low Stats for weekly high/low percentages.
- · Bull/Bear Close for bullish/bearish close percentages.
- · Session H/L for session-based high/low distributions.
2. The statistics table updates to reflect the selected mode.
3. The active button turns light blue, and the chart redraws.
Adjusting Settings
1. Change Lookback Weeks, Offset, or Font Size:
- Enter values in the respective fields (e.g., 26 for Weeks, 10 for Font).
- Click Apply Settings.
- The table updates, and settings are saved to the settings file.
2. Set Custom Date Range: · Enter start and end dates (e.g., 2024.01.01, 2024.12.31).
- Click Apply Range.
- The indicator processes data within the specified range.
3. Modify Session Times:
- Update session start/end times (e.g., 09:00 for AsianStart).
- Click Apply Sessions.
- The session-based analysis (MODE_SESSION) updates accordingly
Toggling Visibility
- Click the Hide button to hide the control panel and tables.
- Click the Show button to restore them.
- The indicator continues running in the background when hidden.
Interpreting Output
- High/Low Stats Table:
- Columns: Day, High %, Low %.
- Rows: Sunday to Saturday.
- Example: “Monday High %: 25.0%” means Monday was the weekly high in 25% of valid weeks.
- Bull/Bear Close Table: · Columns: Day, Bullish %, Bearish %.
- Rows: Sunday to Saturday.
- Example: “Friday Bullish %: 60.0%” means 60% of Fridays closed higher.
- Session H/L Tables: · Four tables (Asian, European, Overlap, US), each with: · Columns: Session Name, High %, Low %.
- Rows: Sunday to Saturday.
- Example: “European Tuesday Low %: 40.0%” means 40% of Tuesdays had their low in the European session.
Best Practices
Ensure Sufficient Data:
- Download historical data via MT5’s History Center (Tools > History Center).
- Select the symbol and timeframes (D1 and H1), then download at least 52 weeks of data.
Validate Session Times:
- Ensure session times align with your broker’s server time and trading strategy.
- Avoid overlapping sessions to prevent errors.
Use Custom Ranges Sparingly:
- Custom ranges require sufficient data within the specified period.
- Revert to default lookback weeks if data is missing.
Monitor Errors:
- Check the error label for issues like “No valid weeks processed” or “Invalid session time format.”
- Refer to the MT5 Experts log (Ctrl+T, Experts tab) for detailed error messages.
Test on Demo Account:
- Apply the indicator to a demo account to familiarize yourself with its features before using it in live trading.
Troubleshooting
No Data Displayed
Cause: Insufficient historical data.
Solution:
- Open History Center (Tools > History Center).
- Select the symbol and Daily (D1) and 1 Hour (H1) timeframes.
- Download data for at least the lookback period (default: 52 weeks).
- Reapply the indicator.
- check the lookback input field, then input the look period if it is set to 1 at the initialization of the indicator.
Error: “No valid weeks processed”
Cause: Missing or incomplete historical data for the selected range.
Solution:
- Reduce the lookback weeks (e.g., from 52 to 26).
- For custom ranges, ensure the start and end dates have available data.
- Check the Experts log for specific data gap dates.
Error: “Invalid session time format”
Cause: Session times are not in HH:MM format or are invalid (e.g., 25:00).
Solution:
- Correct the time format (e.g., 08:00).
- Click Apply Sessions.
Error: “Session times overlap”
Cause: Session time ranges overlap (e.g., Asian ends after European starts).
Solution:
- Adjust session times to be non-overlapping (e.g., Asian 00:00–08:00, European 08:00–12:00).
- Click Apply Sessions.
Indicator Not Visible
Cause: Indicator is hidden via the toggle button.
Solution:
- Click the Show button in the top-right corner.
- If the button is missing, remove and reapply the indicator.
Settings Not Saved
Cause: File write error in Optimus_Time_Tracker_User_settings.txt.
Solution:
- Check the Experts log for file access errors (e.g., permission issues).
- Ensure MT5 has write access to the common data folder (MQL5\Files in the MT5 data directory).
- Manually delete the settings file and reapply settings to recreate it.
Limitations
Data Dependency:
- Requires sufficient D1 (daily) and H1 (hourly) data for accurate results.
- Gaps in data may reduce the number of valid weeks processed.
Broker Timezone:
- Session times are relative to the broker’s server time, adjusted by the Server Time Offset.
- Incorrect offsets may misalign session analysis.
Performance:
- Processing large lookback periods (e.g., > 100 weeks) or custom ranges with extensive data may slow down the indicator depending on the Strength of your Device.
Weekend Data:
- Sunday and Saturday data may be limited, as many markets are closed or have low volume.
Support
For issues not covered in this manual:
- Check the MT5 Experts log for detailed error messages.
- Contact the indicator developer at devinnocentnnaji@gmail.com
- Visit the MQL5 community forums https://www.mql5.com/en/forum for general MT5 support.

