This page is intended for users of the SENTINEL Heikin-Ashi expert advisor (MT5). Here, you will find useful information on how to download and optimize parameter (.set) files to achieve a balance between risk and reward, especially focusing on forward testing. Note that the configurations used in the backtests shown in the screenshots on the product page correspond to the default values.
SENTINEL Heikin-Ashi Set Collection
The parameter configuration (.set) files available on this page are named following this convention:

Interpret as follows:
- Abbreviated name of the expert advisor and version
- Symbol
- Start date of the backtest
- End date
- Timeframe
- Direction (if not specified, includes both)
The strategy direction is included because SENTINEL Heikin-Ashi enables parameter optimization for buy or sell instances separately.
About Backtesting
Backtests are performed over periods of several years to ensure reliable results. To avoid overfitting, parameters are optimized using a portion of the data, reserving the second part for forward testing. This approach minimizes over-optimization risks and helps identify parameter combinations with higher predictive power.
Results that stand out solely for maximum profitability are not considered quality indicators. For this reason, we use the Strategy Tester’s "Complex Criterion max" metric, which integrates key factors such as the number of trades, drawdown, recovery factor, mathematical expectation, and Sharpe ratio. (More information here)
Due to variations in historical data, leverage, broker conditions, and account capital size, it is recommended to perform specific backtests using the data of the intended broker. This practice is even more crucial when working with lower timeframes.
In the SENTINEL Heikin-Ashi Set Collection, configurations that individually fail to outperform the S&P 500 index from 1989 to 2024 are excluded. The S&P 500 had a CAGR (excluding dividend reinvestment) of 7.5%, a maximum drawdown of 57%, and a Sharpe ratio of 0.57. Additionally, the maximum drawdown is normalized to a 12% target.
Visual Backtesting Results
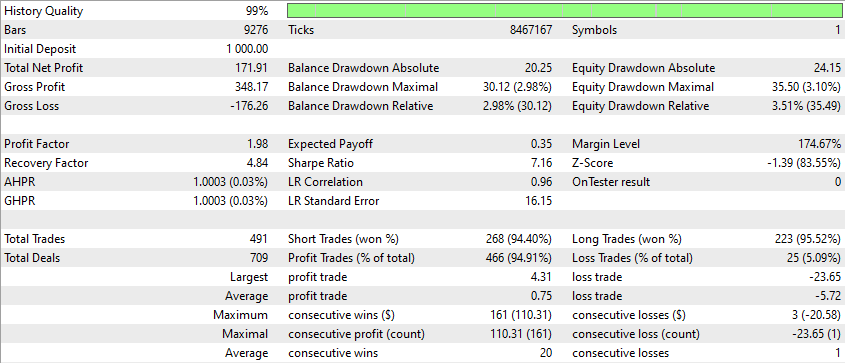
The following are backtesting graphs illustrating the historical performance of the optimized parameters for each included .set file. Although the parameters were adjusted using a forward testing approach, they were applied to the entire analyzed period to generate these visuals. The charts reflect results based on the historical data used; we recommend specific testing with the broker’s data intended for use in each case. Market conditions are dynamic, so updating backtests is advisable if several months have passed since the last review.


