

Technical based trading is extremely popular among both novice and professional traders. There are countless technical methodologies that can be implemented in the market. One such method includes the use of technical oscillators, which will be the focus of this article.
Technical Trading Oscillators
An oscillator is a technical study which traders can use to help them in determining whether a market is trading within an expected range or is trading outside of an expected range such that the market can be considered as overbought or oversold. While some oscillators help in gauging the extremes within a market, others can be used as trend identification oscillators. Trend identification oscillators provide clues as to whether a market is displaying trending characteristics or otherwise.
There are quite a few different names that traders use for oscillators including technical oscillators, trading oscillators, momentum oscillators, forex oscillators, and oscillator indicators. You should not become confused by these different terms as most of them tend to refer to the same thing. Oscillators are often combined with other technical studies such as moving averages, support resistance, and candlestick analysis. Technical oscillators can and do work quite well by themselves in certain market conditions, however, they tend to work even better when combined with some of these other technical elements.
Technical oscillators can provide a myriad of trading signals. Depending on the type of oscillator, this could include signaling an overbought or oversold market condition, a crossover signal indicating that the market is transitioning from bullish to bearish, or bearish to bullish.
Additionally, technical oscillators can be quite useful in determining the terminal points of a price trend. Specifically, they can be used to spot momentum divergences within a financial instrument. Some more advanced traders also utilize technical oscillators in conjunction with Market profile, Elliott wave, or Fibonacci analysis to determine potential inflection points.
As such there is a multitude of ways that a trader can incorporate technical oscillators into their trading methodology. Many of the more conventional methods are presented within traditional technical analysis textbooks and are known to most traders.
Although the traditional methods do work, a trader can gain a better edge by implementing their own twist or method which the majority may not be aware of or have picked up on. This can provide an additional edge that can help boost your overall trading performance. As such, it’s always wise to experiment with different oscillator trading techniques and refine as needed to stay ahead of the game.
Types Of Oscillators
There are scores of different technical oscillators available to traders. Most charting platforms these days provide free access to a multitude of different technical oscillators. However, it’s important to understand that most oscillators tend to fall into one of two buckets.
For example, there are oscillators that are centered around a focal point or line. Within these centered oscillators, the oscillator indicator line will move above and below the centered line. Centered oscillators are helpful in determining trend direction and the momentum within a trend.
For example, when the indicator line within a centered oscillator is registering a reading above the centerline, that is generally indicative of a bullish market condition. Conversely, when the indicator line within a centered oscillators registering a reading below the centerline, that is generally indicative of a bearish market condition.
Obviously, we are generalizing greatly to make a point here, however, this should provide you a 30 foot view of what centered oscillators can be used for. Two of the more popular oscillators that fall within this category include the MACD and the Momentum indicator.
On the other hand, there are oscillators known as banded oscillators. Banded oscillators move between a certain upper threshold commonly referred to as an overbought area, and a lower threshold commonly referred to as an oversold area.
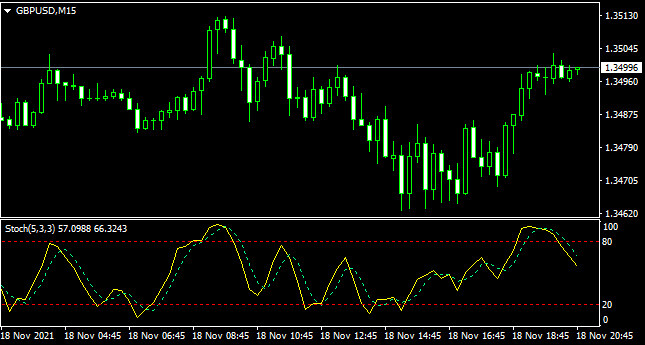
Most momentum oscillators that traders use are actually banded oscillators. These include the popular Relative Strength Index, Stochastics, and Williams %R. Keep in mind that the upper and lower thresholds as defined by each banded oscillator may differ.
For example, the upper threshold indicating an overbought market within the RSI indicator would be at or above 70, while the Williams %R indicator should register a reading of 90 or above for it to indicate an overbought market environment. Within the Stochastics oscillator, it would signal and overbought market when its indicator line reaches a threshold at or above 80. So, as you can see, banded oscillators though similar in their general theme, can and do provide unique signals.
Learn more about indicator and other trading related topics by subscribing to our channel.All my developments: https://www.mql5.com/en/users/genino/seller


