

Most traders will agree that there are few things more enjoyable than riding a steady up trend all the way to the top. Unfortunately, as the old adage goes, “all good things must come to an end”. This is particularly true in trading which is why it is essential to understand when a move to the downside is likely to emerge and how to manage your risk accordingly. In this article, we will share with you what the hanging man candlestick reversal pattern is and how to trade it.
WHAT IS THE HANGING MAN?
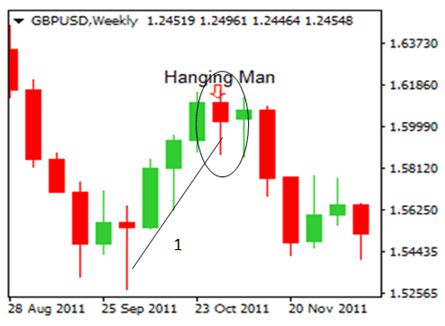
A hanging man candle (aptly named) is a candlestick formation that reveals a sharp increase in selling pressure at the height of an existing uptrend. This is generally brought about by many market participants believing the market has reached its highest level resulting in the ‘bears’ outweighing the ‘bulls’. This can be observed in the GBPUSD chart below where it is clear to see the red candle appearing at the top of the upward trend as a result of mass selling pressure.
GBP/USD HANGING MAN CANDLESTICK
CHARACTERISTICS OF THE HANGING MAN CANDLE
The hanging man candle is characterized by having a small real body, little or no upper shadow (wick) and a lower shadow at least twice the length of the body.
- Upward trend: The hanging man can only be identified as such once it has formed at the top of an uptrend.
- Opening level: The hanging man candle can either be a green candle (bullish), or a red candle (bearish) although, the bearish candle provides a better indication of a weakening market.
- Upper shadow: A small upper shadow indicates that there was an attempt to maintain the current uptrend before the significant drop in the price of the Pound Sterling.
- Long lower shadow: This is probably one of the most insightful observations on the candle, depicting a significant sell off before the bulls tried to regains some ground forcing the closing price to end up somewhat closer to opening levels but still down for the period.
- Closing level: In this case the closing level was below the opening level and therefore, confirms that this is a bearish hanging man candle.
IDENTIFYING HANGING MAN CANDLESTICK TRADING SIGNALS
The hanging man candlestick can be used to identify a short trade (bearish view of the market) as the long shadow indicates massive selling. The true test of the legitimacy of the hanging man candlestick is often revealed in subsequent activity on the chart. If the following candle moves further down and breaks below the short term upward trend line, this can be seen as a continuation of the downward long term trend. Another possible entry level could be to enter the trade once the market has moved past the low of the hanging man candle.
TRADING THE HANGING MAN?
It is important to view the hanging man candle formation in relation to the long term trend. The best way to do this is to make use of multiple time frame analysis. Start off by viewing the market using a longer time frame chart like the daily or weekly time frame to observe the direction the market is tending to in the long term. Then, zoom-in using a smaller time frame chart (4 hour or 2 hour) to analyze the ideal entry point for your trade.
Step 1: Identify the long term trend
View the chart on a longer time frame (perhaps a daily chart) to get an idea of the direction the market is heading. You do not want to place a trade in the opposite direction of the long term trend.
Step 2: Spotting your ideal entry point
Making use of a shorter time frame chart (4 hour chart), identify the ideal entry point. The hanging man candle formation provides us with a signal for a short trade.
Step 3: Make use of supporting indicators
Does the Relative Strength Index confirm that the market has turned and now in a downward trend? Has the 20 SMA line crossed over the 50 SMA line? Does the hanging man candlestick appear near the top of the short term uptrend? Is a relevant Fibonacci retracement level nearby?
Step 4: Place your trade
Look for an entry point at the low of the hanging man candlestick. If your bearish view of the market is correct, you will see subsequent price action moving down – providing you with an indication to place your short trade.
Step 5: When to close out of the trade?
Whenever entering a trade it is always best to have at least a 1:2 Risk-to-Reward ratio. You are risking half of what you intend to gain. This means that the distance from your entry level to your take profit level should be twice the distance from your entry level to your stop loss level.
All my developments: https://www.mql5.com/en/users/genino/seller


