
The "Stochastic Advanced" indicator will display the signals of the 'Stochastic" indicator directly on the chart without the presence of the indicator "Stochastic" itself at the bottom of the screen. The indicator signals can be displayed not only on the current timeframe, but also on a timeframe one level higher. In addition, we have implemented a filter system based on the moving average, which turned the indicator into an analogue of the “Three Screens of Elder” strategy.
The indicator is available for both versions of the trading terminal:
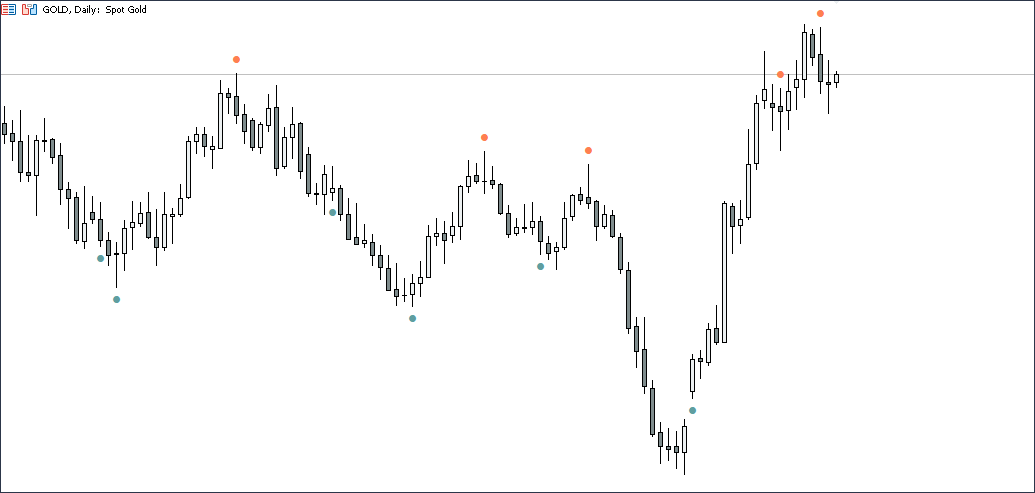
Appearance of the indicator
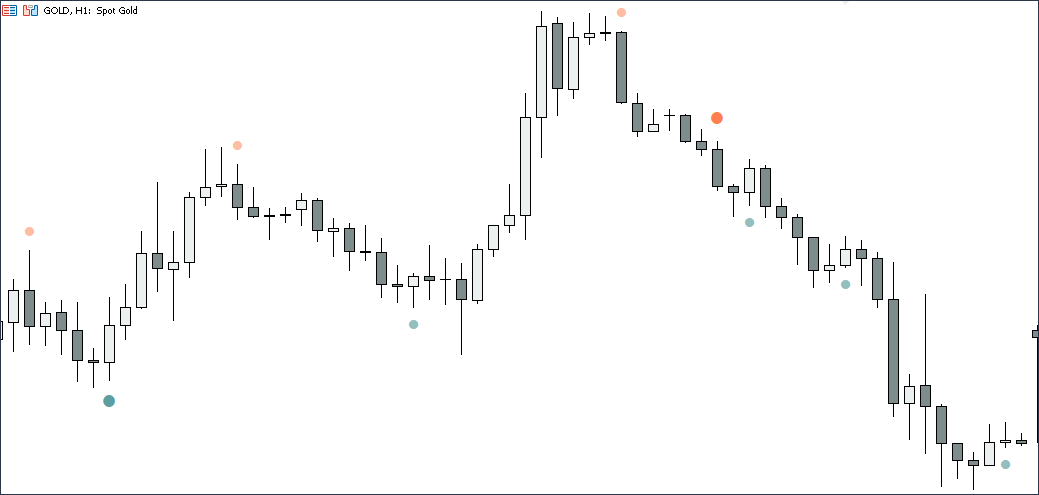
By default, the indicator displays reversal signals of the "Stochastic" indicator. If the indicator turns above level 80, a red dot appears - a signal to sell. if the indicator turns below level 20, then a green dot appears - a buy signal.
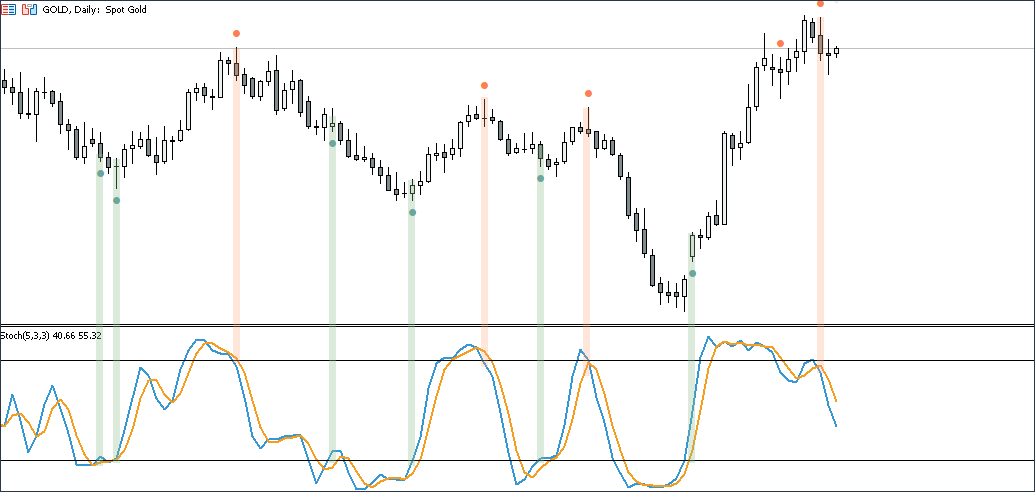
If you add the standard "Stochastic" indicator to the chart, you will notice that reversal signals appear at the intersection of levels 80 and 20 with the main (blue) line of the indicator. See example below:
There are two options for displaying indicator signals:
By closing(Default value)
- Sell - The main line of the indicator crossed the 80 level from top to bottom and at the moment the candle closed, it was below it.
- Buy - The main line of the indicator crossed level 20 from bottom to top and at the moment the candle closed, it was above it.
At current price(Not recommended)
- Sell - The main line of the indicator crossed the level of 80 from top to bottom.
- Buy - The main line of the indicator crossed level 20 from bottom to top.
Signal filtering. Elder's Three Screen System
In the indicator settings, you can choose which time frame to use to filter "Stochastic" signals. The "Elder's Three Screens" system involves filtering the current timeframe using a timeframe at a higher level. For example, if you are trading H4, then the trend should be determined by D1. If you are trading H1, then the trend is determined by H4. The "EMATimeframe" parameter is responsible for this.
In the example below you can see the difference in the indicator with and without a filter.
Option without filter
As you can see, in the picture below there are both upward and downward signals of the "Stochastic" indicator.
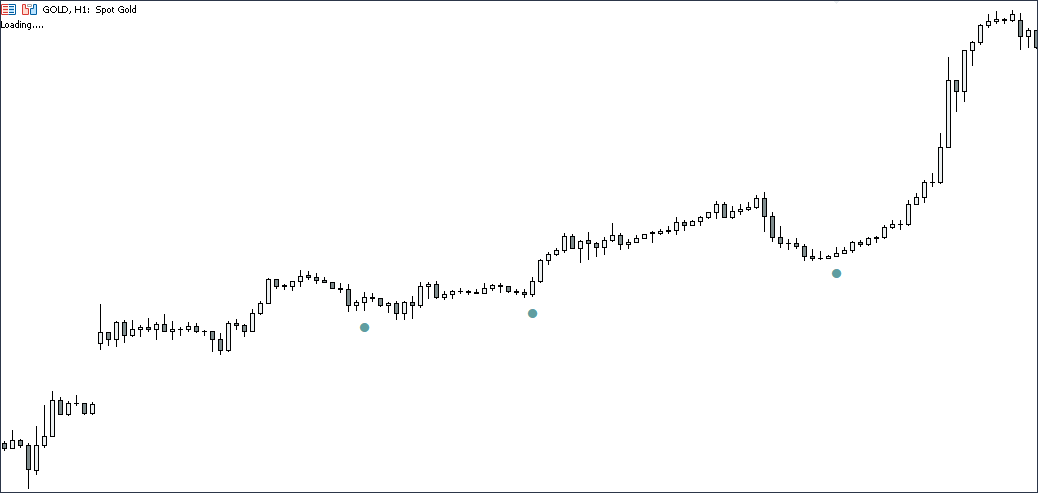
Option with filter
In the example below, the filter is turned on and the indicator perceives signals only in that section of the chart that is above the moving average on the H4 timeframe.
Currently there is a certain disadvantage in this system, which we plan to fix in the next update. By default, only 1 timeframe can be set for the filter. For example, if you set a filter by H4, then any timeframe on which we are located will be filtered by H4. Therefore, if you want to analyze H4, for example, with the condition of determining the trend by D1, then you will need to change the filter from H4 to D1 in the external parameters of the indicator.
In the next update we plan to make this system automatic. This means that each time the filter will adapt to the timeframe you are on.
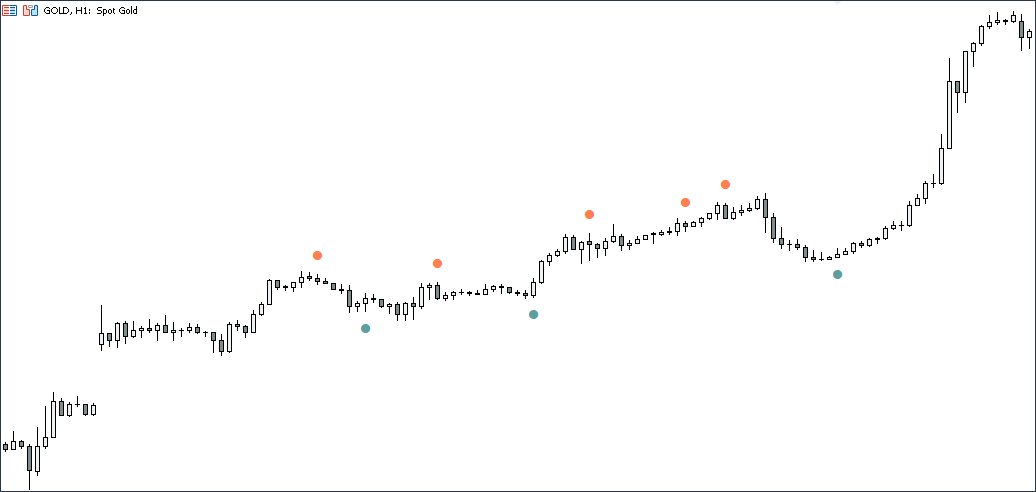
Timeframe one level higher
We also decided to add to the indicator the ability to receive signals from a timeframe one level higher. In the picture below we are in the H1 timeframe. The signals of the "Stochastic" indicator on H1 are displayed in small light circles. "Stochastic" signals from H4 are shown as darker and larger circles.
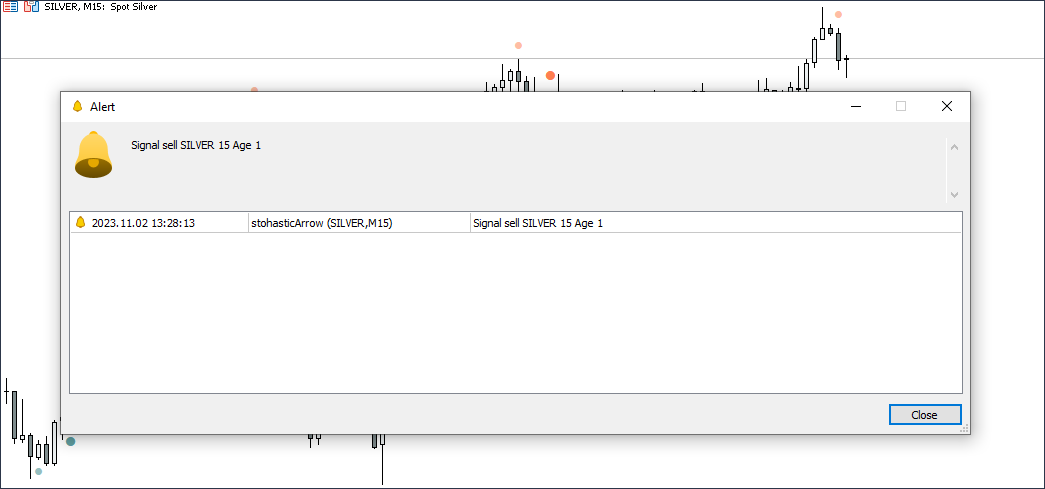
Alerts
The indicator implements a system of alerts and push notifications. To activate it, in the external parameters of the indicator, opposite “AlertFound”, select “True”. After activating the alert system, when the “Stochastic” indicator signal is found on the price chart, the indicator will issue a notification about this.
External parameters
- Leveltop - Overbought level
- LevelBottom - Oversold level
- ShowLastBars - Number of bars to display indicator signals
- Usesignal - Use or not signal line crossing
- ClosePrice - Apply to close or current price
- ShowHigh - Show or not a signal for a higher timeframe
- ParentTimeFrames - Use classic (H1, H4, D1) or new (H1, H2, H5, H6, H8) timeframes
- AlertFound - Enable or disable alerts
- SendPush - Enable or disable push notifications
- FilterEMA - Enable or disable the filter by moving average
- Period - MA Period
- Shift - MA Shift
- Method - MA Method
- EMA_Timeframe - MA timeframe
- IconSize - The size of the arrow icons
- IconColorUp - Long signal color
- IconColorDown - Short signal color
- Lines - Attach or not a vertical line to the arrow
- LineColorUp - The color of the vertical line for long signal
- LineColorDown - Color of the vertical line for short signal
- styleLine - Select line style
- Icon - Select icon for arrows
- Indent - Deviation of the arrow from the current price up or down
- IconColorParentUp - Long signal color for the older TF
- IconColorParentDown - Short signal color for the older TF
- LinesParent - Use or not lines for the olderTF
- LinesColorParentDown - Color of lines for short signal for senior TF
- LinesColorOarentUp - The color of the lines for long signal for the older TF
- styleLineParent - Line style for the older timeframe
- IconParent - Icon type for senior TF
- IndentParent - Icon deviation from the current price up or down for the old TF


")
