
The "Gartley Hunter" indicator is designed to search for and display harmonic trading patterns or Gartley patterns on the chart. The search for patterns can be done both in constant automatic scanning mode and using hot keys.
The indicator is able to find patterns of any size from the smallest to the largest. For convenience, the indicator is equipped with a system of alerts and push notifications, which allows you not to miss a pattern when it appears. We also implemented a very detailed customization system.
Disclaimer:
- The indicator is available for the fourth and fifth versions of the trading terminal:
If during testing in stratagy tester you do not see patterns, make sure you click the "Scan" button on the indicator panel.
Harmonic Trading: Available Patterns
Currently the following patterns are implemented in the indicator. In the future, the list will definitely be replenished. - Gartley
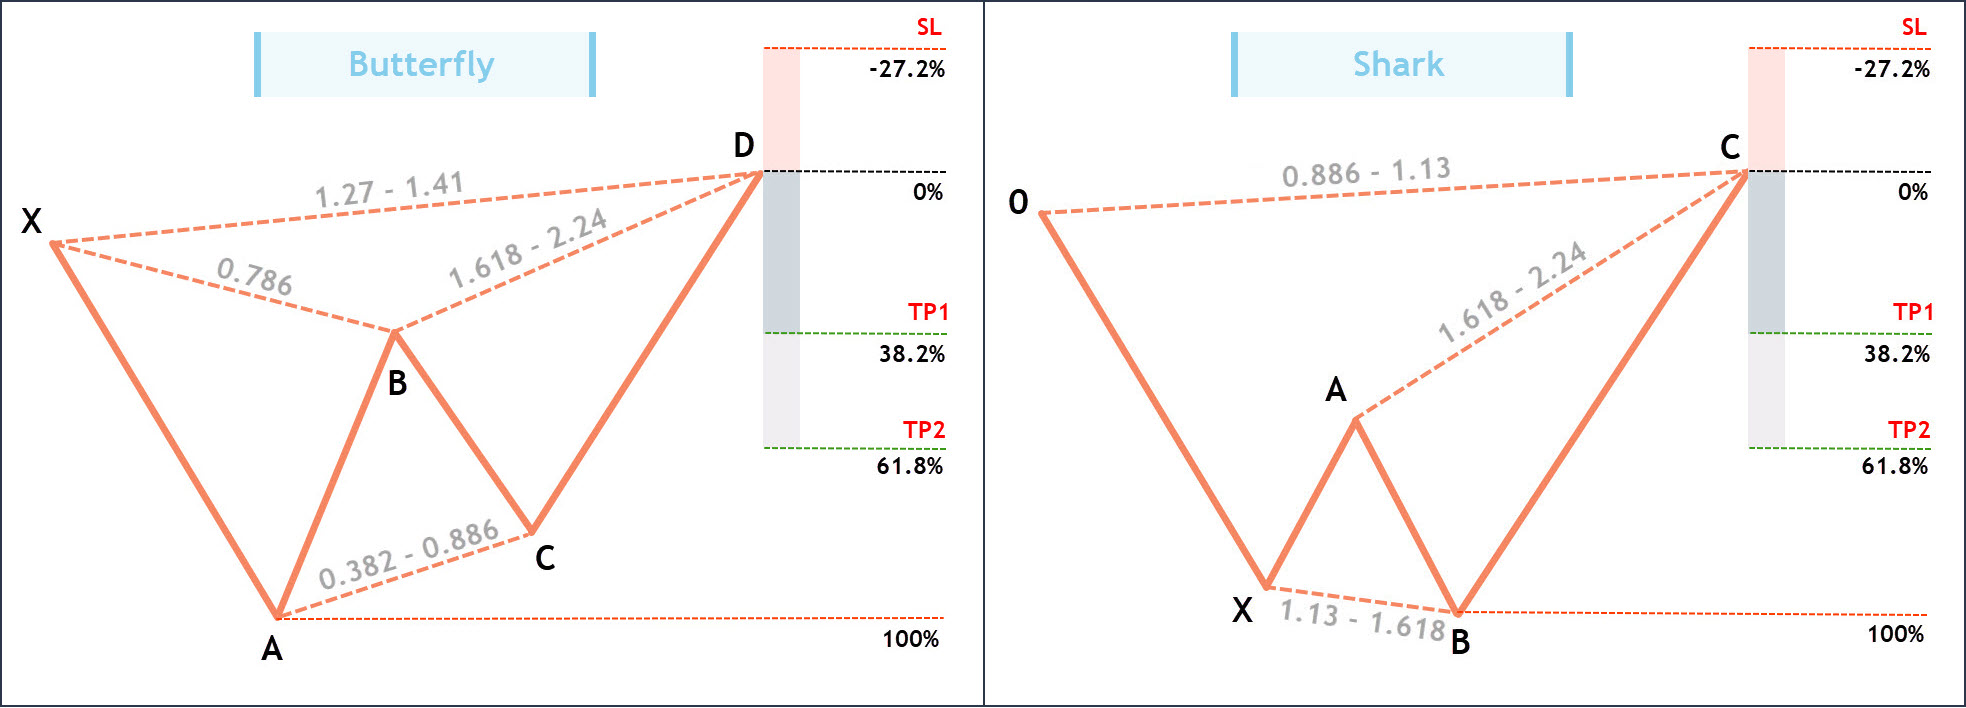
- Butterfly
- Shark
- Crab
- Bat
- Alternate bat
- Cypher
- Deep crab
- Anti Gartley
- Anti Bat
- Anti Butterfly
- Anti Cypher
"Zigzag" indicator
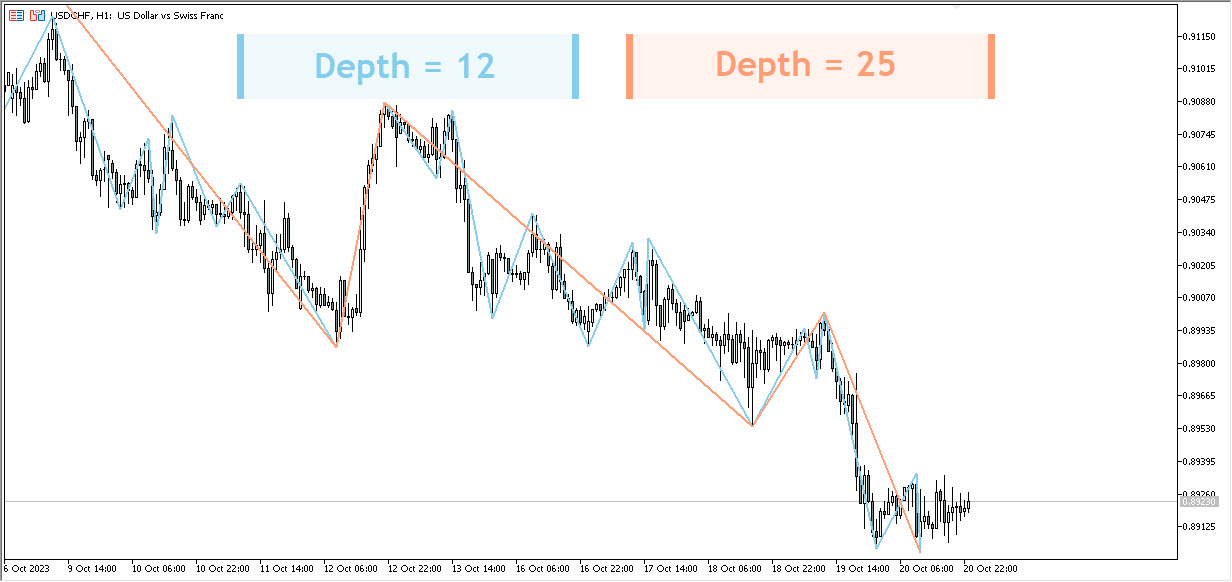
The "Gartley Hunter" indicator is based on the "Zigzag" indicator. The essence of this indicator (Zigzag) is to connect extreme points (maximum and minimum points on the chart). This happens according to a certain formula, which is based on one key parameter: “Depth”.
Without going into details, we can say that this parameter is responsible for the magnitude or size of extrema. The larger this parameter, the larger and more significant extrema it connects. In the picture below you can see the difference between depth parameters 12 and 25.
Logic of the "Gartley Hunter" indicator. Pattern sizes
The "Gartley Hunter" indicator takes segments constructed using the "Zigzag" indicator and uses it to search for and construct harmonic patterns. For these purposes, we have introduced a minimum and maximum depth parameter, which can be changed in the external parameters of the indicator:
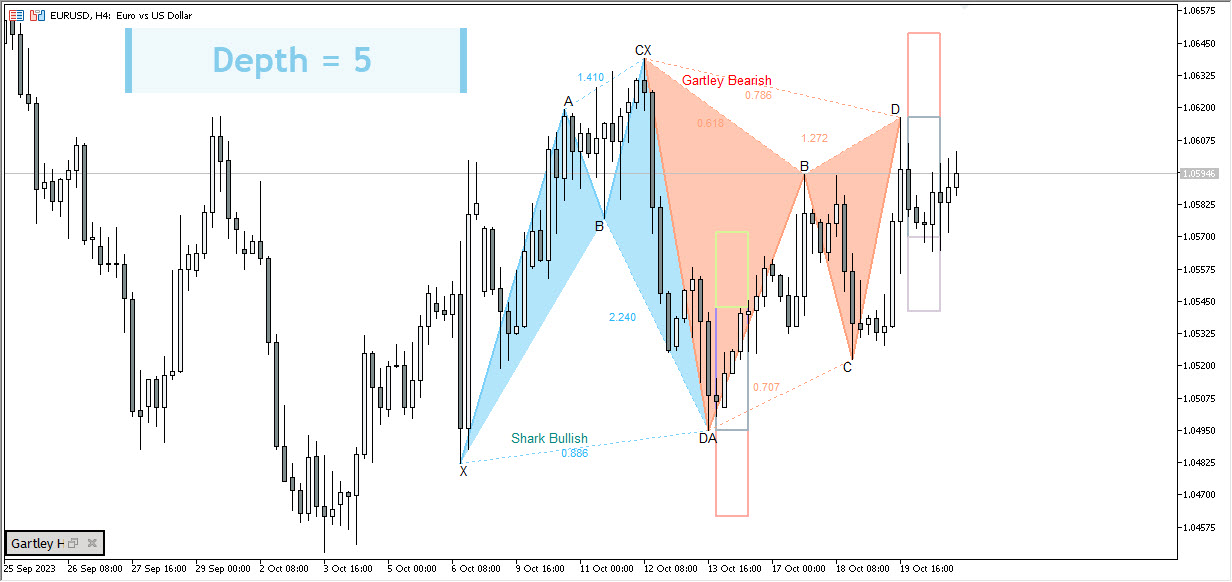
- "ExtMindepth" is responsible for the smallest harmonic patterns. The default value is 5.
- "ExtMaxdepth" is responsible for the largest harmonic patterns. The default value is 30.
These settings are optimal, but you can change it if you wish. For example, if you don't want to use the smallest harmonic models, then you can increase the minimum depth parameter ("ExtMindepth") to 10.
The picture below shows examples of small patterns with a depth of 5.
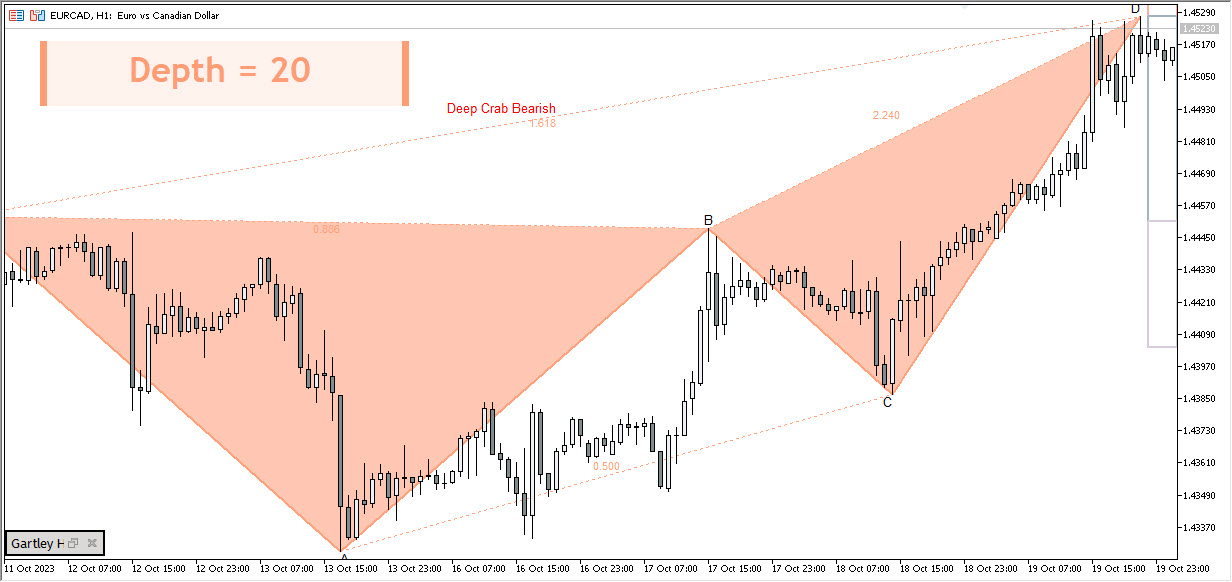
And here we have medium patterns with a depth of 20.
Logic of the "Gartley Hunter" indicator. Scan step
Let's study a new important parameter - "Scan step". This parameter is responsible for the step within which the indicator will move from the smallest to the largest indicator depth parameter. By default, 'scan step' = 5.
For example, to scan the depth range from "ExtMindepth" = 5 to "ExtMaxdepth" = 30, the indicator needs to perform 6 scans: 5,10,15,20,25,30. At each of the scanned depth levels, the indicator can find a harmonic pattern. This means that several patterns may appear on the chart at once - large and small.
If we, for example, change the "scan step" to 1, then it will be more thorough: 5,6,7,8,9,10,11,12,13,14,15,16,17,18,19,20,21,22,23,24,25,26,27,28,29,30. Thus, the indicator will perform 26 scans instead of 6. A more thorough scan loads the computer more, but allows you to find absolutely all possible harmonic patterns. However, there is no particular need for it. Most of the patterns can be found with "scan step" = 5.
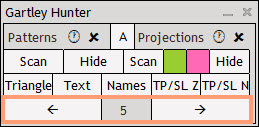
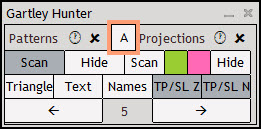
The "Scan Step" parameter can be decreased or increased directly from the indicator panel. The left arrow decreases it, and the right arrow increases it.
Automatic pattern scanning
The search for patterns occurs automatically. To activate it, you need to click the "Scan" button on the left side of the panel under the inscription "Patterns". Now the search for patterns will be carried out constantly and will not be reset until you turn it off. It is not affected by rebooting the terminal or changing timeframes.
Manual pattern scanning
Automatic scanning occurs when new ticks arrive in the terminal. For most trading instruments, this is only relevant on weekdays. Scanning is also launched when switching timeframes (with the "Scan" button pressed). If the market is closed, automatic scanning will not work. For these purposes, we have introduced a manual scanning mode.
To manually scan the chart, click on the circle with the clock (Hot keys "Shift + Z"). To delete patterns, click on the cross next to it(Hot keys "Shift+X").
Pattern Projections
Projections are patterns that have not yet been formed, but will appear if the price reaches point D of the projection. The price of its formation is also indicated there. The appearance of a projection does not mean that the pattern will go to point D. It means that it will appear if the price gets there. Many people make the mistake of opening a trade expecting a movement to D.
To activate the automatic search for projections, you need to click the "Scan" button on the right side of the panel under the "Projections" inscription, and then decide on the direction of pattern formation. Pressing the green button will turn on ascending patterns, and pressing the red button will turn on descending patterns. Manual scanning of projections is carried out in the same way as pattern scanning.
Hidden Pattern Projections
Despite the fact that pattern projections are very useful because they allow you to prepare for the moment the pattern is formed, it is simply not convenient to see them constantly on the screen. To solve this problem, we added a "Hide" button, which is located on the right side of the panel. When you click on it, the projections are hidden and displayed as horizontal lines on the right side of the screen.
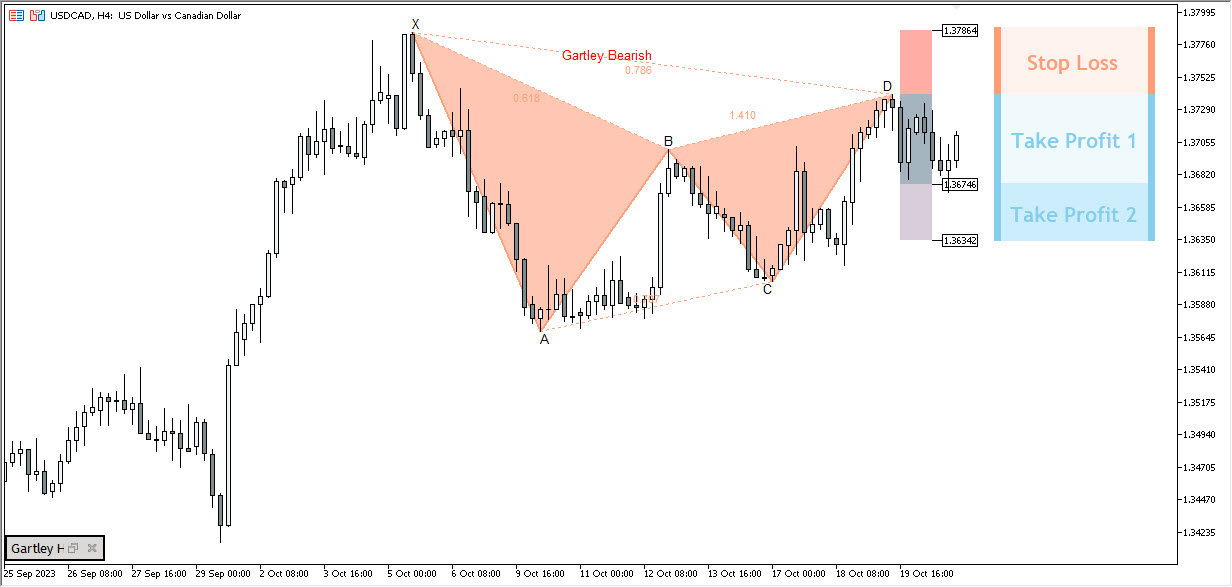
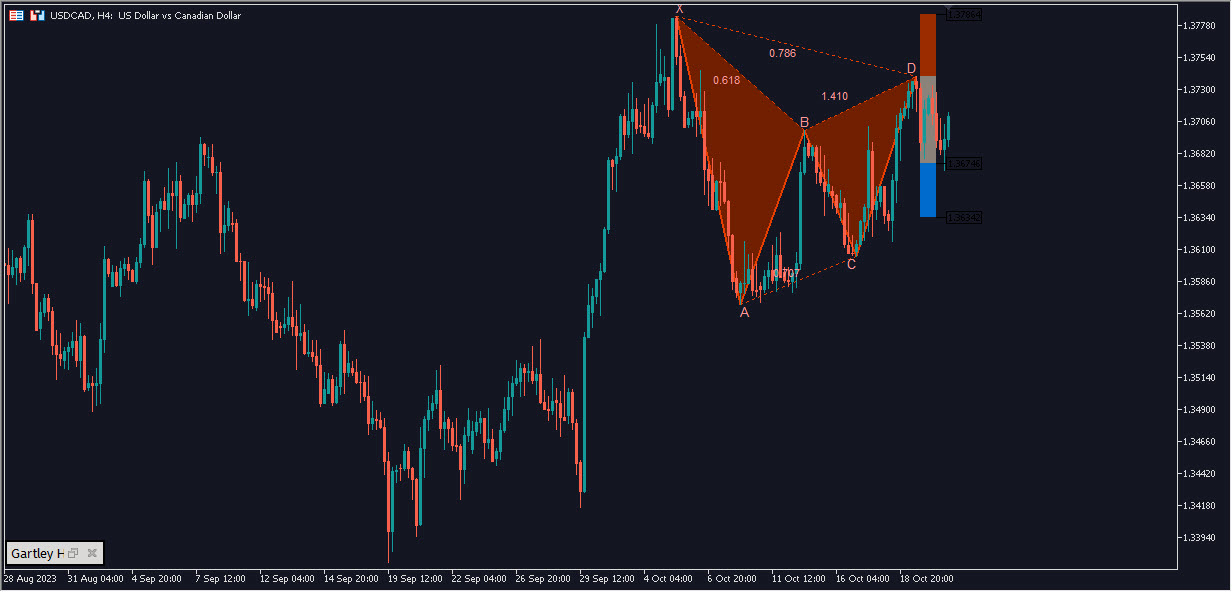
Stop Loss and Take Profit levels
To the right of each pattern you can see vertical rectangular areas that are responsible for the Stop Loss and Take Profit zones. These are the average values of stops and profits that are triggered most often. Take Profit levels are taken from Scott Cairney's book "Harmonic Trading". Stop Loss levels are determined empirically and are calculated based on the Fibonacci grid, which is built based on the size of the pattern.
Appearance of patterns. Changing Pattern Elements
The indicator panel contains buttons that are responsible for the appearance of the pattern:
- Triangle - Remove shading of triangles
- Text - Remove letters A-B-C-D-E, as well as Fibonacci levels
- Names - Remove pattern names
- TP/SL Z - Remove filling of Stop Loss and Take Profit zones
- TP/SL N - Remove price tags at Stop Loss and Take Profit levels
By default, all elements are enabled and clicking on one of the buttons will remove one of the elements you do not need. Thus, in a couple of clicks you can customize the convenient appearance of the pattern. See the example in the picture below:
Pattern overlay
In some cases, we may observe a situation where two patterns appear in the same place, where one pattern may overlap the other. You can see an example in the picture below:
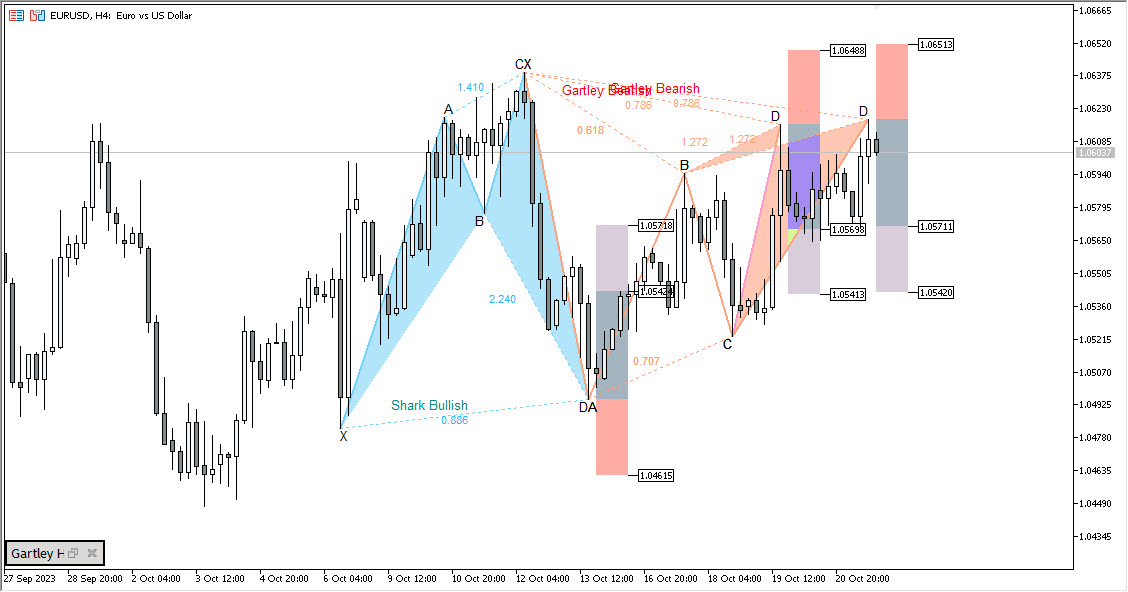
As you can see, where patterns of the same color overlap (red on red in the example above), the color disappears. This is due to the features of the trading terminal. Subsequently, with the addition of new patterns to the indicator, this problem may become more widespread.
To normalize the appearance of the pattern, the bottom indicator panel described above can also help in this case. As shown in the picture below, you can give the pattern an easy-to-read appearance in a few clicks:
Appearance of patterns. Indicator elements colors
The colors of all pattern elements can be changed. This way you can choose the optimal visual template for your screen color scheme. You can see which parameter is responsible for which color below in the “External parameters” section.
In the example below, I tried to match the pattern colors to the dark gamma of the screen.
Alert System
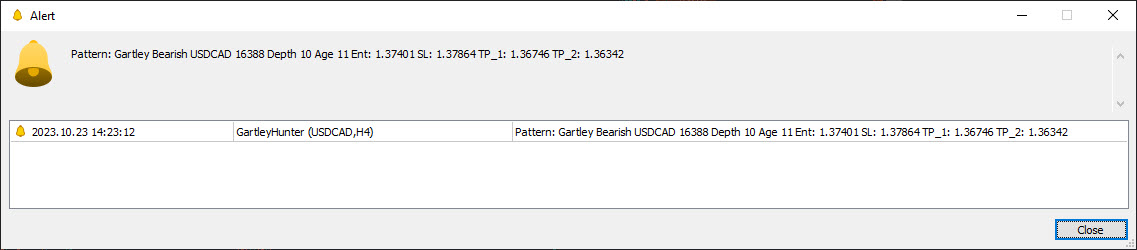
We have implemented a system of Alerts and Push notifications in the indicator. Alerts are activated by pressing the "A" button on the indicator panel. Push notifications are enabled in the external parameters of the indicator. "UsePushWithAlert" parameter.
When a pattern appears on the price chart, the indicator will notify you about it. He will provide the following information:
- Pattern name
- Pattern direction
- The instrument on which the pattern appeared
- Depth (pattern size)
- Pattern age
- Stop Loss level value
- Take Profit 1 level value
- Take Profit 2 level value
Such a detailed description was made at the request of users who trade from their phones. At the same time, the alert system is implemented to the greatest extent in the multi-version of the indicator. It is characterized by the analysis of several dozen financial instruments at once in all possible price ranges. In such a situation, alerts become most relevant.
Redrawing patterns. Several levels of confirmation
The indicator does not redraw patterns. It forms it exactly in those zones in which it is provided for by the harmonic trading system. At the same time, there are some cases in which an inexperienced user may mistake what is happening on the chart for redrawing. Let's look at it.
1. A little theory
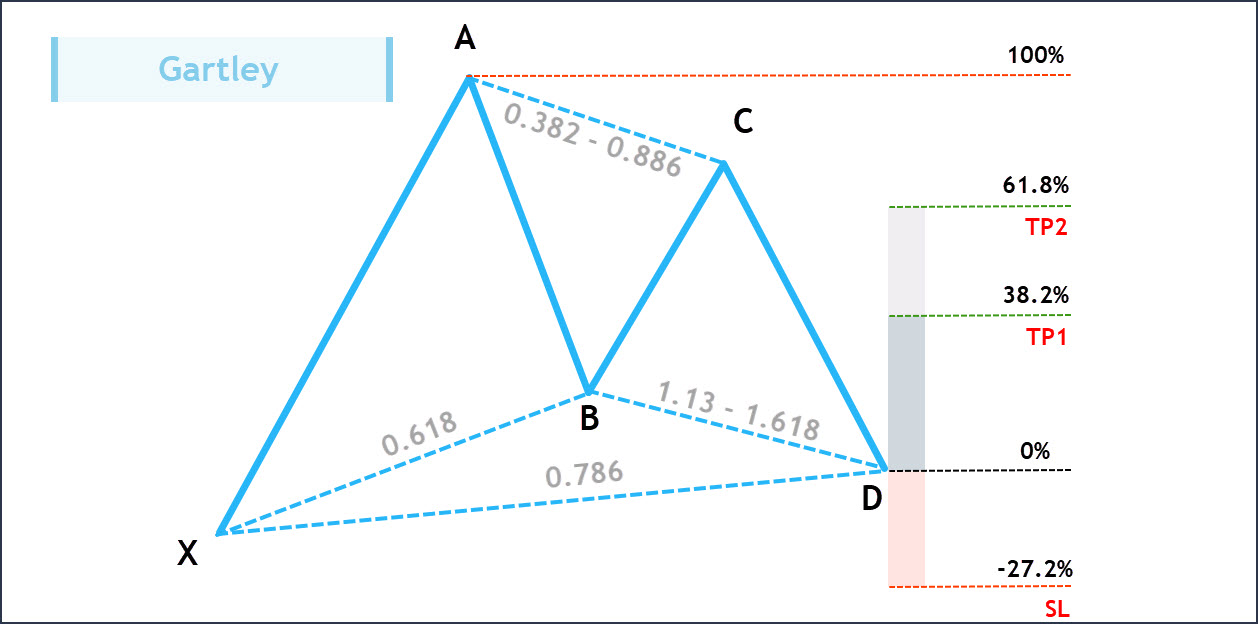
If you are familiar with the Harmonic Trading system, you know that the final precise pattern formation is point D. It is built using several Fibonacci grids at once, but the key measurement is the ratio of A-B-C-D or A-D to X-A.
Let's look at the example of the "Gartley" pattern below. Its formation point is determined by the 78.6 Fibonacci level (X-D). Otherwise, A-B-C-D = XA * 0.786. Accordingly, this pattern simply cannot be redrawn because it is not given the framework of the system. That means it simply has nowhere to go. A single final point of formation is present in 9 patterns out of 12. That means 9 of 12 patterns are not redrawn.
2. Patterns "Butterfly", "Anti-butterfly" and "Shark"
There are three patterns that have several possible levels of formation. For example, if we look at the left side of the picture below, we will find that the Butterfly pattern can be formed from both the 1.272 level and the 1.41 level. This means that price can reverse from each of these levels, which means we have 2 potential reversal patterns, not just one. Accordingly, if one of the levels, for example 1.272, is broken, the indicator will redraw the pattern at 1.41 if it is confirmed. This logic is embedded in the harmonic trading system.
Redrawing patterns. Horizontal offset
It is also worth analyzing the situation where the right wing of the pattern can shift horizontally. This can happen when the price does not make sudden movements in any direction, but continues to be within the target zone of the pattern.
1. A little theory
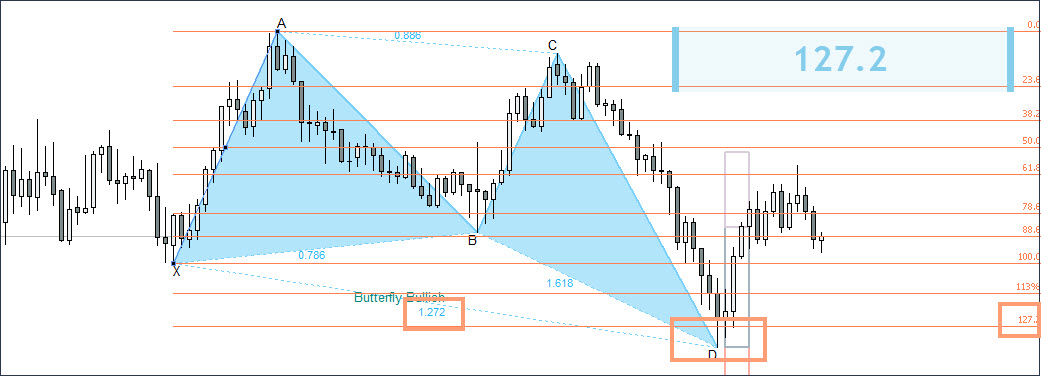
The final point of pattern formation is determined when the price closes above (for buy) and below (for sell) the key Fibonacci level. In the example below, pay attention to the “Butterfly” pattern, which showed its first level of pattern development. The key point here is to break the 127.2 level and close the price above this level.
Now imagine a situation in which the second candle after the signal (point D) would break through the low formed by point D of the pattern and return again, closing above the level of 127.2. In such a situation, the conditions of the pattern would also be met, because the closure would again occur above the level of 127.2. But at the same time, we would get a lower low level, and the right wing of the pattern would move two candles to the right and slightly lower.
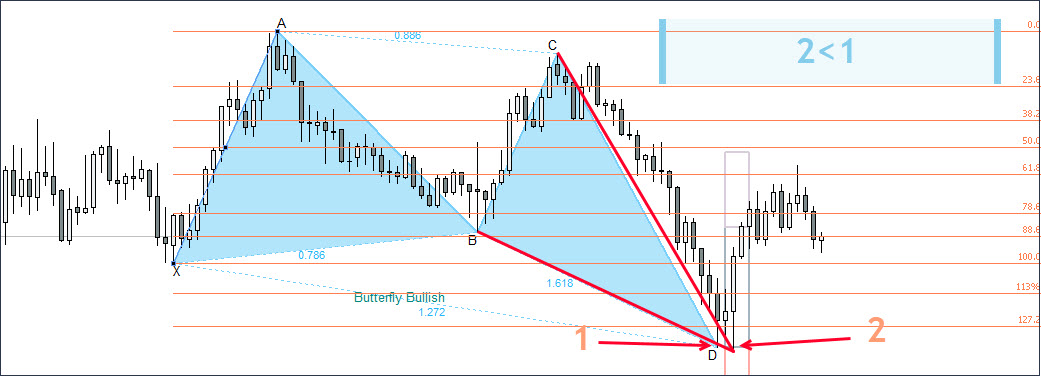
The figure above describes this hypothetical situation. In fact, the pattern moved a little lower, but at the same time all the conditions for its formation remained fulfilled. In fact, this can also be called redrawing, but it again fits into the rules of the classical system of Harmonic trading, since the conditions for pattern formation are met at both point 1 and point 2.
Admittances
To understand what admittances are, you first need to understand the principle of forming an ideal Gartley pattern.
An ideal pattern implies an ideal ratio of all segments along Fibonacci levels, where each segment, upon closing, complied with the rules of the level's formation.
- Formation of the upper Fibo level is a situation where the price approaches the level from bottom to top, touches it, and then closes below the level.
- Formation of the lower Fibo level is a situation where the price approaches the level from top to bottom, touches it, and then closes above the level.
If these conditions are met for each segment of the pattern, the pattern is considered ideal. But imagine for a moment the following situation:
On the daily chart, a “Gartley” pattern is formed, which perfectly formed all three segments: AB to XA, BC to AB and CD to BC. But the final segment (AD to XA) did not reach the target level of 78.6 by a couple of points, which does not play any role for the daily chart (we are talking about a couple of points).
Question: Should this pattern be considered confirmed or not? After all, the conditions were not met - the level was not touched. A person in such a situation will conclude that the pattern has been formed, but for the robot the conditions will not be met and it will not draw the pattern.
For such situations, we introduced an admittances system that is responsible for two aspects:
Candle shadow admittances - The percentage of possible failure of the candle shadow to reach the target level. Parameter "ExtUncertaintyShadow" = 30. It's calculated based on the distance from the target level to the previous one. Using the "Gartley" pattern as an example, the target level is 78.6%, and the previous one is 61.8%. The distance between levels is taken as 100%. The "ExtUncertaintyShadow" parameter = 30 means that the pattern will be displayed if the shadow of the candle goes into the upper (for sell level) or lower ( for buy level ) 30% of the range of levels 61.8% and 78.6%.
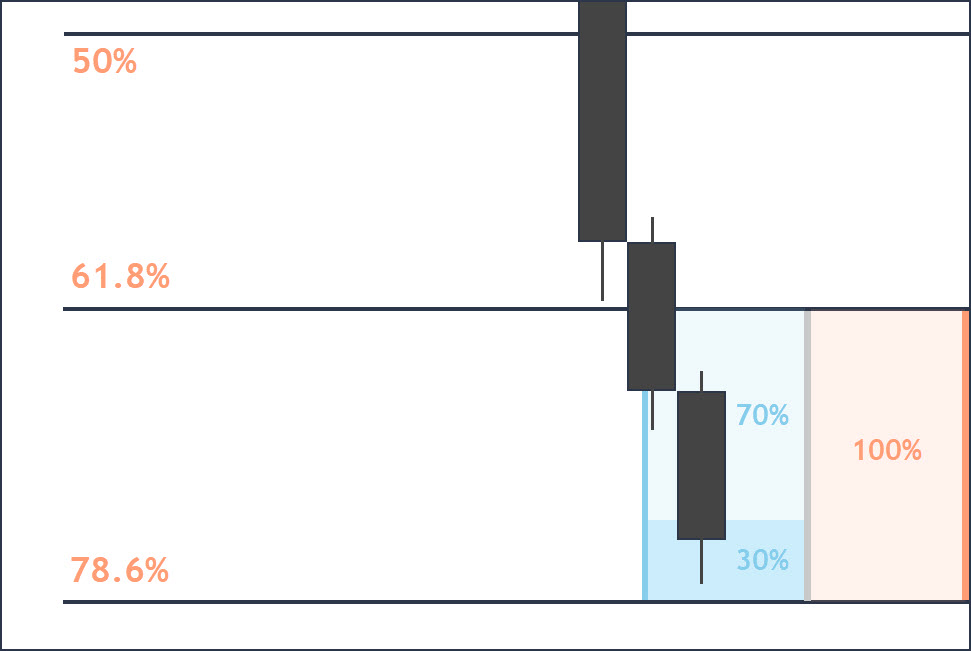
The picture above shows this logic schematically. We see that the price did not reach the target level just a little, but at the same time fell into the admittances zone. Under such conditions, the pattern will be displayed by the indicator.
Candle body admittances - The percentage of the candle body that can go beyond the target level. Parameter "ExtUncertaintyHead" = 30. It is calculated based on the distance from the target level to the next one. Using the "Butterfly" pattern as an example, the target level is 127.2%, and the next one is 141%. The distance between levels is taken as 100%. The parameter "ExtUncertaintyHead" = 30 means that the pattern will be displayed if the body of the candle enters the upper (for buy level) or lower (for a sell level) 30% of the range of levels 127.2 and 141.
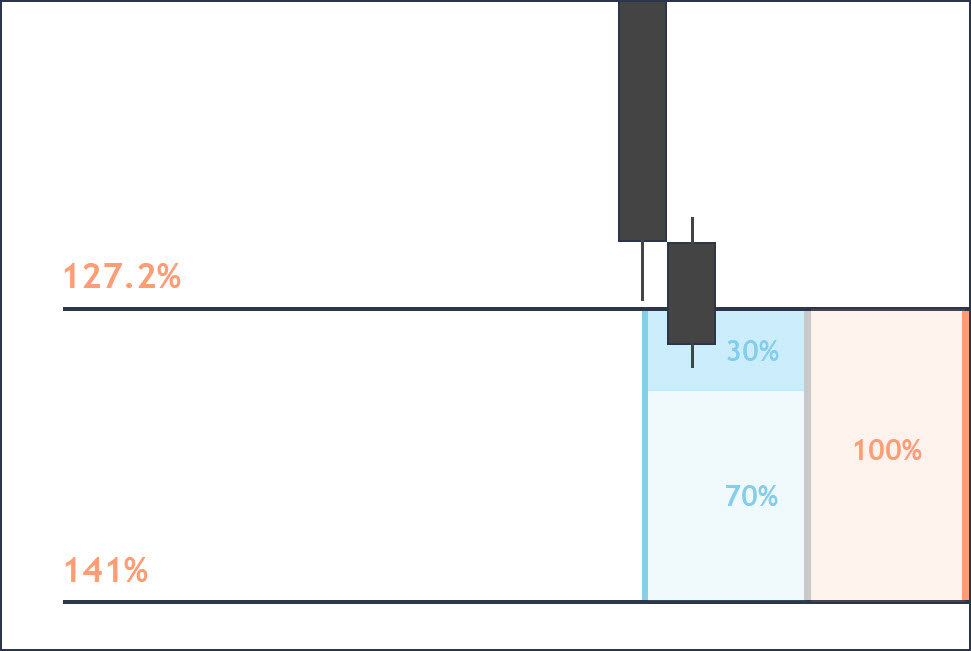
In the picture above we see that the closing price of the candle slightly exceeded the level 127.2 we needed, falling within the acceptable admittances level of 30%. In such a situation, the pattern will be displayed.
If desired, the value of both types of admittances can be set to 0%, which will imply drawing only ideal patterns. But, as practice shows, admittances are necessary, since completely ideal patterns appear extremely rarely.
You can test different admittances values, which can range from 0% to 45%, and see how accurately the harmonic models perform. According to our experience, an admittances value of 30% for shadows and for bodies is optimal.
Disappearance of patterns
The harmonic pattern will remain on the chart as long as the conditions for its formation are met (stopping and closing the candle within the Fibonacci zone). If after the formation of the pattern the price moves in the direction we need, the pattern will remain on the chart.
If the pattern did not live up to expectations and after its appearance the price went in the opposite direction, the pattern will disappear, since the conditions for its formation will no longer be met (the price passed the Fibonacci zone required by the conditions of the pattern and closed above or below it).
But, as practice shows, patterns that appear, but are then canceled, can also turn the market around and go into profit without breaking through the Stop Loss zone (this zone exists for these purposes). Therefore, if the pattern was confirmed and you opened an order, after which the pattern disappeared (since its conditions are no longer met), do not rush to close an order until the Stop Loss is triggered.
In the example below you can see a similar situation:
This example was taken from the strategy tester - therefore, the pattern after the breakdown of the minimum was saved. On a real chart, when you change the time frame, the pattern will disappear because the indicator will scan the chart again and this time the conditions for the formation of the pattern will not be met.
External parameters
Author: Siarhei Vashchylka. For any questions, write to me in private messages. I also recommend subscribing to my updates. To do this, follow the link to my profile and click "Add to friends".


