

✔️ Elliott Wave Counter MT4©: https://www.mql5.com/en/market/product/14016
✔️ Elliott Wave Counter MT5©: https://www.mql5.com/en/market/product/15081
Most of those who trade in Forex are aware of the Elliott Wave Analysis System.
So what is this wave analysis: This is the study and analysis of price, and not its derivatives (various indicators); The ability to determine price targets using Fibonacci tools (Elliott waves are closely related to Fibonacci numbers).
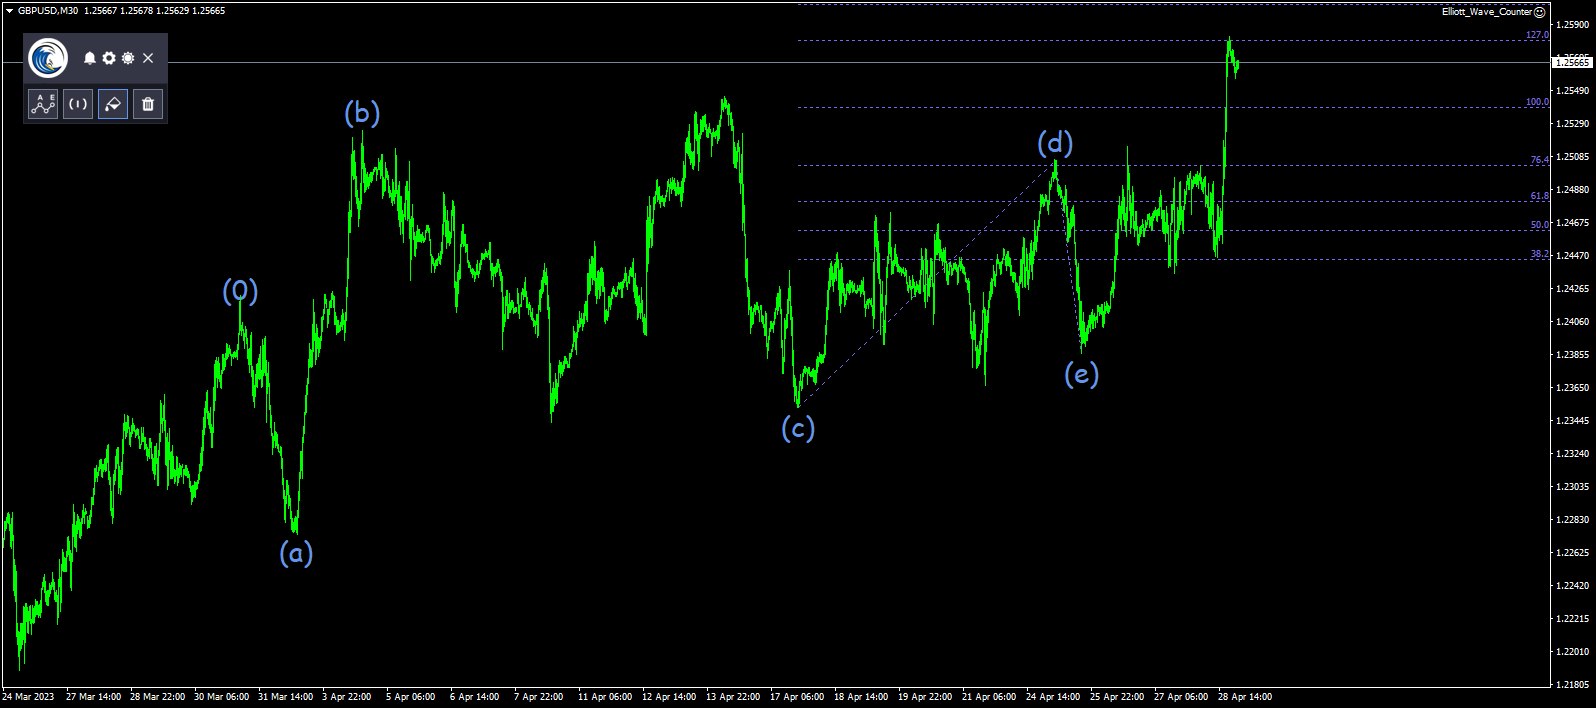
Elliott Wave Counter is a panel for rapid and user-friendly manual markup of Elliott waves. One can select a color and a level of marks. There are also functions for removing the last markup and the entire markup made by the tool. Markup is made in one click. Click five times - have five waves! Elliott Wave Counter will be a great instrument both for beginners and professional analysts of Elliott waves.
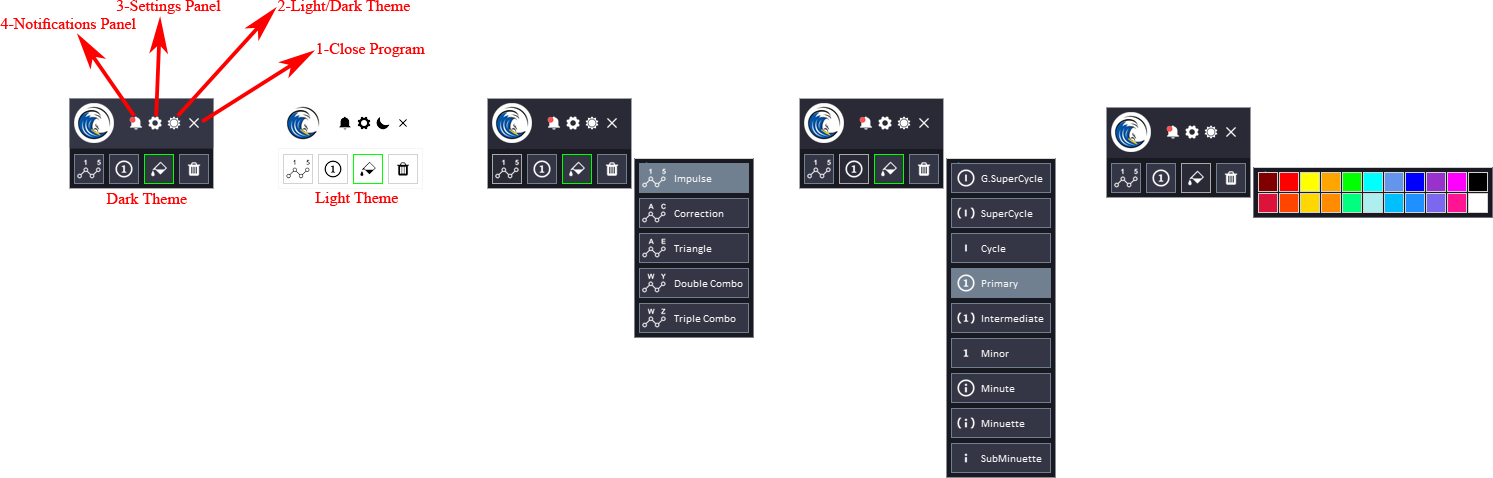
Main Panel Explanation:
-
Close EA Button: This button is used to stop the Expert Advisor (EA) and remove it from the chart.
-
Light/Dark Button: This button is used to switch between a light and dark theme for the panel. This button can be helpful if you find one of the themes too bright or too dark and want to switch to the other one.
-
Settings Panel Button: This button is used to open the settings panel for the EA. The settings panel allows you to configure various settings for the EA.
-
Notifications Panel Button: This button is used to open the notifications panel for the EA. The notifications panel displays important notifications.
-
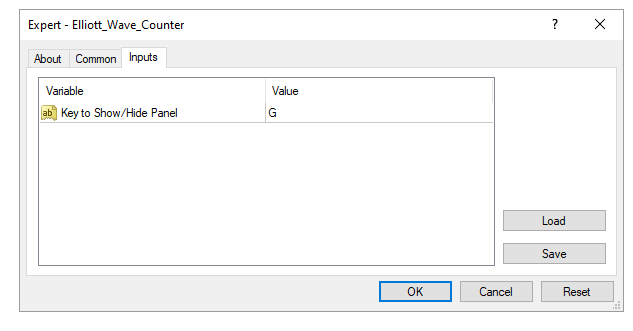
Show/Hide Panel Key: a shortcut to show and hide panel by using your keyboard.
General Inputs:
- Wave Type Button: This button allows users to select the type of wave pattern they want to highlight on the chart. The options available include impulse waves, corrective waves, and other custom wave patterns.
- Wave Level Button: This button allows users to select the level of wave pattern they want to highlight on the chart. The options available include primary, intermediate, and minor wave levels.
- Wave Color: This button allows users to choose the color of the wave patterns they want to highlight on the chart. Users can select from a range of colors to suit their preference.
- Delete All Button: This button allows users to delete all selected objects on the chart, including any wave patterns that have been marked using the Elliott Wave Counter.
How the program works:
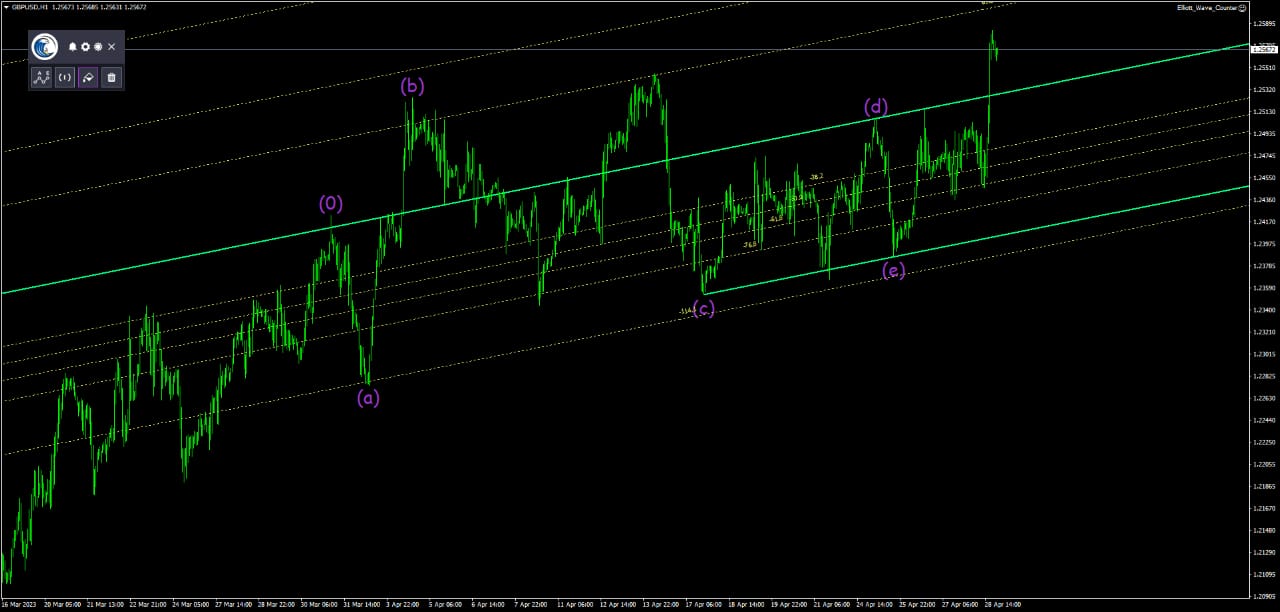
First, Select the type of wave pattern you want to highlight on the chart using the Wave Type button. The options available include impulse waves, corrective waves, and other custom wave patterns.
Select the level of wave pattern you want to highlight on the chart using the Wave Level button. The options available include primary, intermediate, and minor wave levels.
Then if you need to change the color of the wave, you can choose the color of the wave patterns you want to highlight on the chart using the Wave Color button. This allows you to customize the appearance of the wave patterns to suit your preference (this will help you to differentiate between alternate wave counts).
The tool is ready to start marking, after clicking, you can place labels on the chart by moving the mouse and pressing the draw shortcut. Simply move your mouse to the desired bar where your wave starts. A curser line will indicate the bar that you are pointing at. If you place your mouse below the bar the low of the bar will be used as price reference, if you place your pointer above the bar the high of it will be the price reference. Make a click when ready.
After setting the wave's start point, the first wave will appear under the mouse. This could be 1, A or W depending upon the pattern that you are counting. In the same manner, set the point for placing the first wave. No matter how high or low you place your wave, the curser line will be your wave's time reference, and the high (if you clicked above the bar) or the low (if you clicked below the bar) will be your wave's price reference. Price reference and time reference will be used to calculate the projections for the next waves.

Select/Deselect Waves;
Now, by pressing select shortcut key you can select/deselects all objects on the chart.
Deleting all objects:
If you want to delete all objects on the chart, including any wave patterns that have been marked using the Elliott Wave Counter, click on the Delete All button or press the delete all shortcut key.
Deleting the last wave:
Just click on one of the pattern's waves, and then press the delete last shortcut key and the last wave of your pattern will be deleted. Press the key as many times as you need to reach the desired wave and delete it.
Bind Waves:
You can also press bind shortcut key to move the labels to the high and low and organize it.
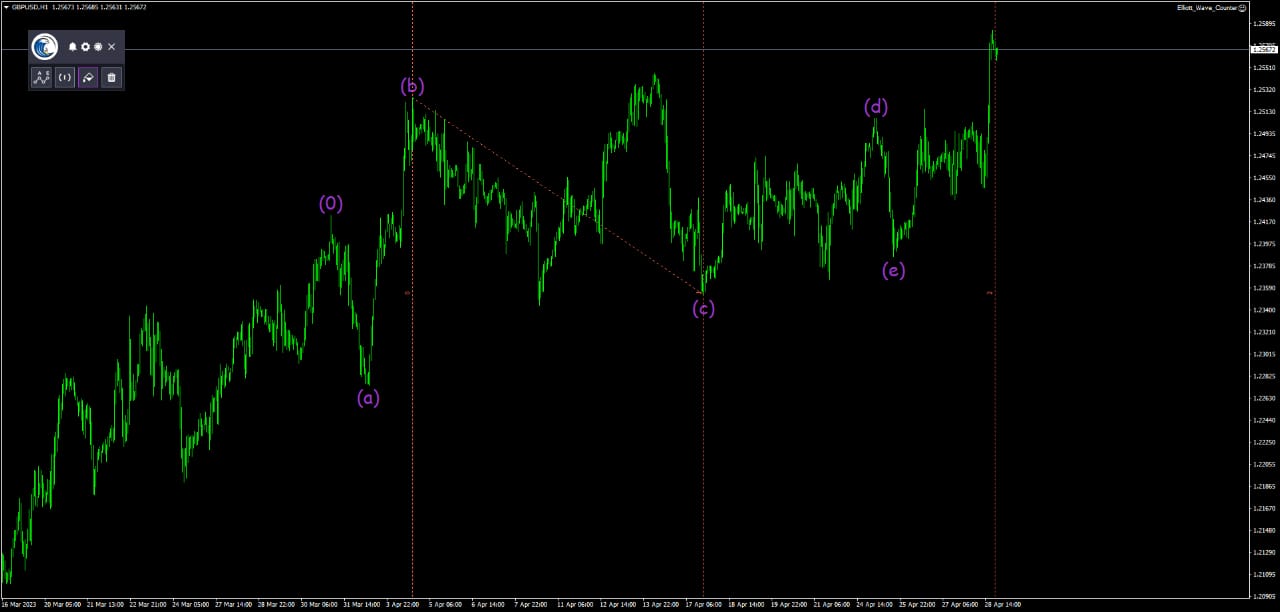
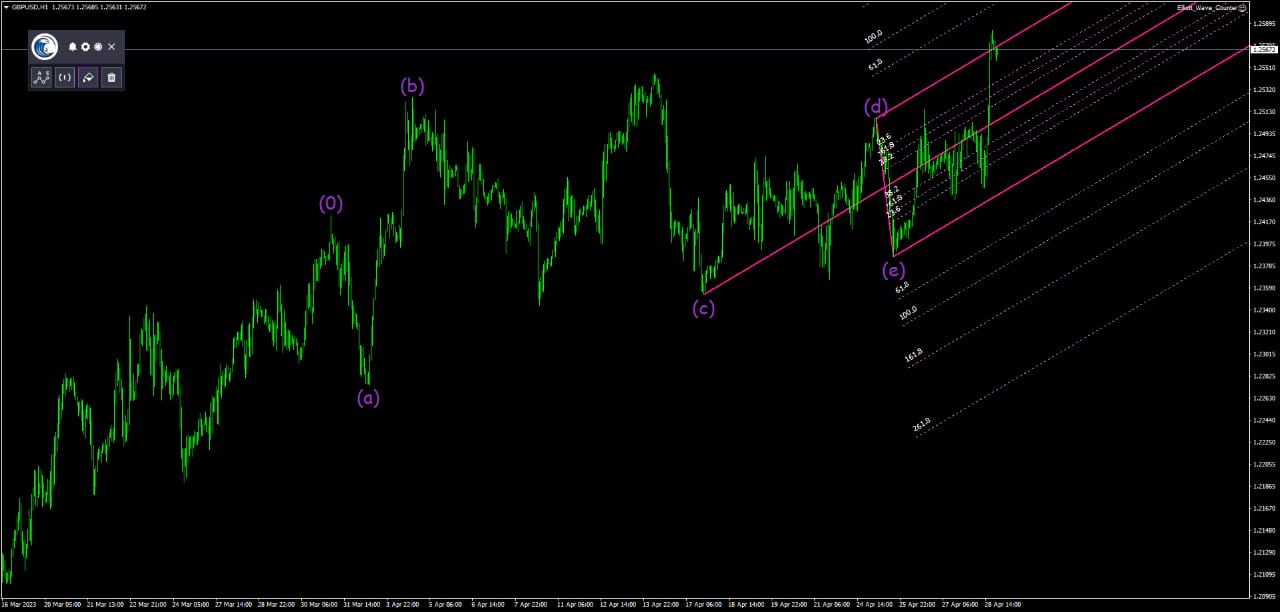
Fibonacci Channel:
When selecting the waves and pressing the Fibo Channel shortcut key, the tool will display the channels between the waves.
Fibonacci time zones:
When selecting the waves and pressing the Fibo Times shortcut key, the tool will display the Fibonacci time zones between the waves.
Fibonacci expansion levels:
When selecting the waves and pressing the Fibo Target shortcut key, the tool will display the Fibonacci expansion levels between the waves.
Pitchfork levels:
When selecting the waves and pressing the Pitchfork shortcut key, the tool will display the Pitchfork levels between the waves.
Settings Panel Explanation:
The Settings Panel include different tabs to make its easier to select and change the settings. 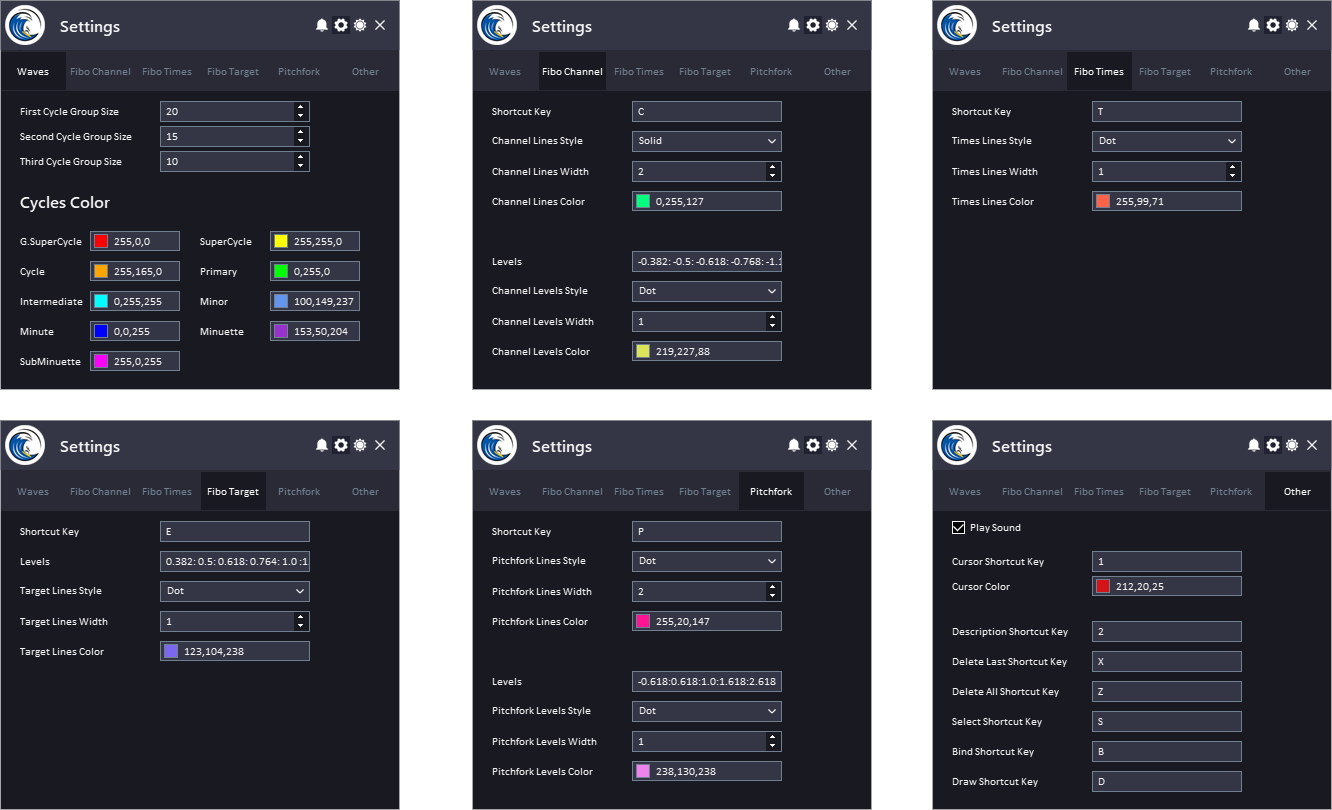
Wave Tab:
In this tab you can specify the size and the color of the cycles groups that the tool uses to draw Elliott Waves on the chart.
Fibonacci Channel Tab:
The Fibonacci Channel is a technical analysis tool used by traders to identify potential support and resistance levels in a price chart. Here are the inputs for the Fibonacci Channel and their explanations:-
Shortcut key: This refers to the keyboard shortcut used to activate the Fibonacci Channel tool on a trading platform.
-
Levels: This refers to the specific Fibonacci retracement levels used to draw the channel. The most common levels used are 38.2%, 50%, and 61.8%, although traders may use additional levels based on their trading strategy.
-
Line Width: This refers to the thickness of the lines that make up the Fibonacci Channel. Traders can adjust the line width to make the channel more or less prominent on the chart.
-
Line Style: This refers to the style of the lines that make up the Fibonacci Channel. Traders can choose from different styles, such as solid lines, dotted lines, or dashed lines.
-
Color: This refers to the color of the lines that make up the Fibonacci Channel. Traders can choose from different colors to make the channel more visually appealing or to match their personal preferences.
The same Settings can be applied on the level's lines.
Fibonacci Times Tab:
The Fibonacci Time Zone is a technical analysis tool used by traders to identify potential support and resistance levels in a price chart based on time intervals. Here are the inputs for the Fibonacci Time Zone and their explanations:
-
Shortcut key: This refers to the keyboard shortcut used to activate the Fibonacci Time Zone tool on a trading platform.
-
Line Width: This refers to the thickness of the lines that make up the Fibonacci Time Zone. Traders can adjust the line width to make the zones more or less prominent on the chart.
-
Line Style: This refers to the style of the lines that make up the Fibonacci Time Zone. Traders can choose from different styles, such as solid lines, dotted lines, or dashed lines.
-
Color: This refers to the color of the lines that make up the Fibonacci Time Zone. Traders can choose from different colors to make the zones more visually appealing or to match their personal preferences.
Fibonacci Target Tab:
The Fibonacci Expansion is a technical analysis tool used by traders to identify potential levels of support and resistance, as well as potential price targets, in a price chart. Here are the inputs for the Fibonacci Expansion and their explanations:
-
Shortcut key: This refers to the keyboard shortcut used to activate the Fibonacci Expansion tool on a trading platform.
-
Levels: This refers to the specific Fibonacci retracement levels used to draw the expansion levels. The most common levels used are 38.2%, 50%, 61.8%, 100%, 138.2%, 161.8%, 200%, and 261.8%, although traders may use additional levels based on their trading strategy.
-
Line Width: This refers to the thickness of the lines that make up the Fibonacci Expansion. Traders can adjust the line width to make the expansion more or less prominent on the chart.
-
Line Style: This refers to the style of the lines that make up the Fibonacci Expansion. Traders can choose from different styles, such as solid lines, dotted lines, or dashed lines.
-
Color: This refers to the color of the lines that make up the Fibonacci Expansion. Traders can choose from different colors to make the expansion more visually appealing or to match their personal preferences.
Pitchfork Tab:
The Pitchfork, also known as the Andrews Pitchfork, is a technical analysis tool used by traders to identify potential levels of support and resistance in a price chart. Here are the inputs for the Pitchfork and their explanations:
-
Shortcut key: This refers to the keyboard shortcut used to activate the Pitchfork tool on a trading platform.
-
Levels: This refers to the specific levels used to draw the Pitchfork. The most common levels used are the median line, which is drawn from the highest high or lowest low to the midpoint of the price action, and the upper and lower parallel lines, which are drawn equidistant from the median line at levels of support and resistance.
-
Line Width: This refers to the thickness of the lines that make up the Pitchfork. Traders can adjust the line width to make the Pitchfork more or less prominent on the chart.
-
Line Style: This refers to the style of the lines that make up the Pitchfork. Traders can choose from different styles, such as solid lines, dotted lines, or dashed lines.
-
Color: This refers to the color of the lines that make up the Pitchfork. Traders can choose from different colors to make the Pitchfork more visually appealing or to match their personal preferences.
The same Settings can be applied on the level's lines.
Other Settings Tab:
-
Play Sounds: This input refers to a feature that plays a sound effect every time an action is performed.
-
Cursor Pointer Shortcut Key: This is the keyboard shortcut used to activate the cursor pointer mode in the Elliott Wave Counter tool. When this mode is activated, a cursor pointer appears on the chart, and the user can move it around to determine the optimal placement for the label.
-
Level Description Shortcut Key: This is the keyboard shortcut used to activate the Level Description mode in the Elliott Wave Counter tool.
-
Delete All Shortcut Key: This is the keyboard shortcut used to delete all the wave markers on the chart at once.
-
Delete Last Shortcut Key: This is the keyboard shortcut used to delete the last wave marker added to the chart.
-
Draw Shortcut Key: This is the keyboard shortcut used to activate the drawing mode in the Elliott Wave Counter tool.
-
Bind Shortcut Key: This is the keyboard shortcut allows the user to attach the wave count label to the price point on the chart, such as the high or low of a candle. This can help organize the labels on the chart and make it easier for the user to keep track of the wave count.
-
Select Shortcut Key: This is the keyboard shortcut used to activate the selection mode in the Elliott Wave Counter tool. This allows the trader to select and modify existing wave on the chart.
Notifications Panel Explanation:
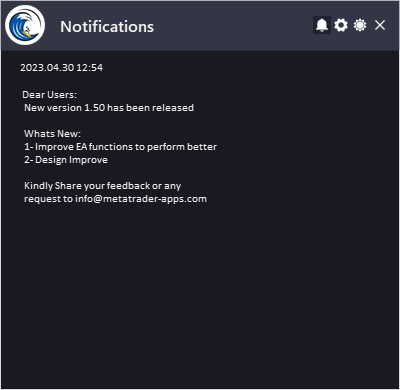
The Date refers to the date and time when the notification was generated.
The Notification refers to the message that is displayed. This can include information about the EA or the updates or message from the developer.
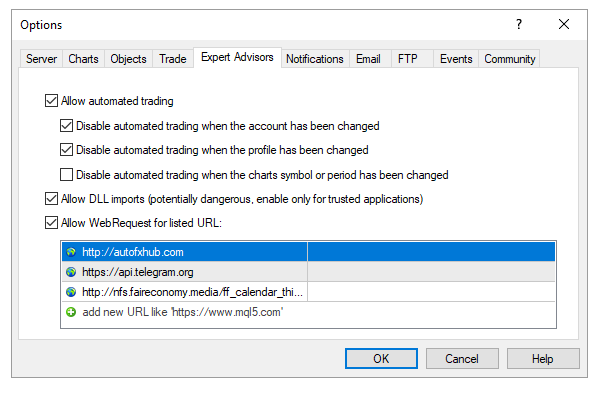
To allow EA getting the notifications, you need to add our website link to the list of allowed URLs in the platform's settings.
Here are the steps to add a link to the allowed URLs list in MetaTrader (Check The Image Below):
- Open the MetaTrader platform and go to "Tools" in the top menu, then select "Options".
- In the "Options" window, click on the "Expert Advisors" tab.
- Check the "Allow WebRequests for listed URL" option and click on the "Add" button.
- In the "New URL" field, enter the URL that you want to allow web requests for (http://autofxhub.com).
- Click "OK" to save the URL to the list of allowed URLs.
✔️ Elliott Wave Counter MT4©: https://www.mql5.com/en/market/product/14016
✔️ Elliott Wave Counter MT5©: https://www.mql5.com/en/market/product/15081


