ETHUSD: Bullish Harami Pattern Above $1237
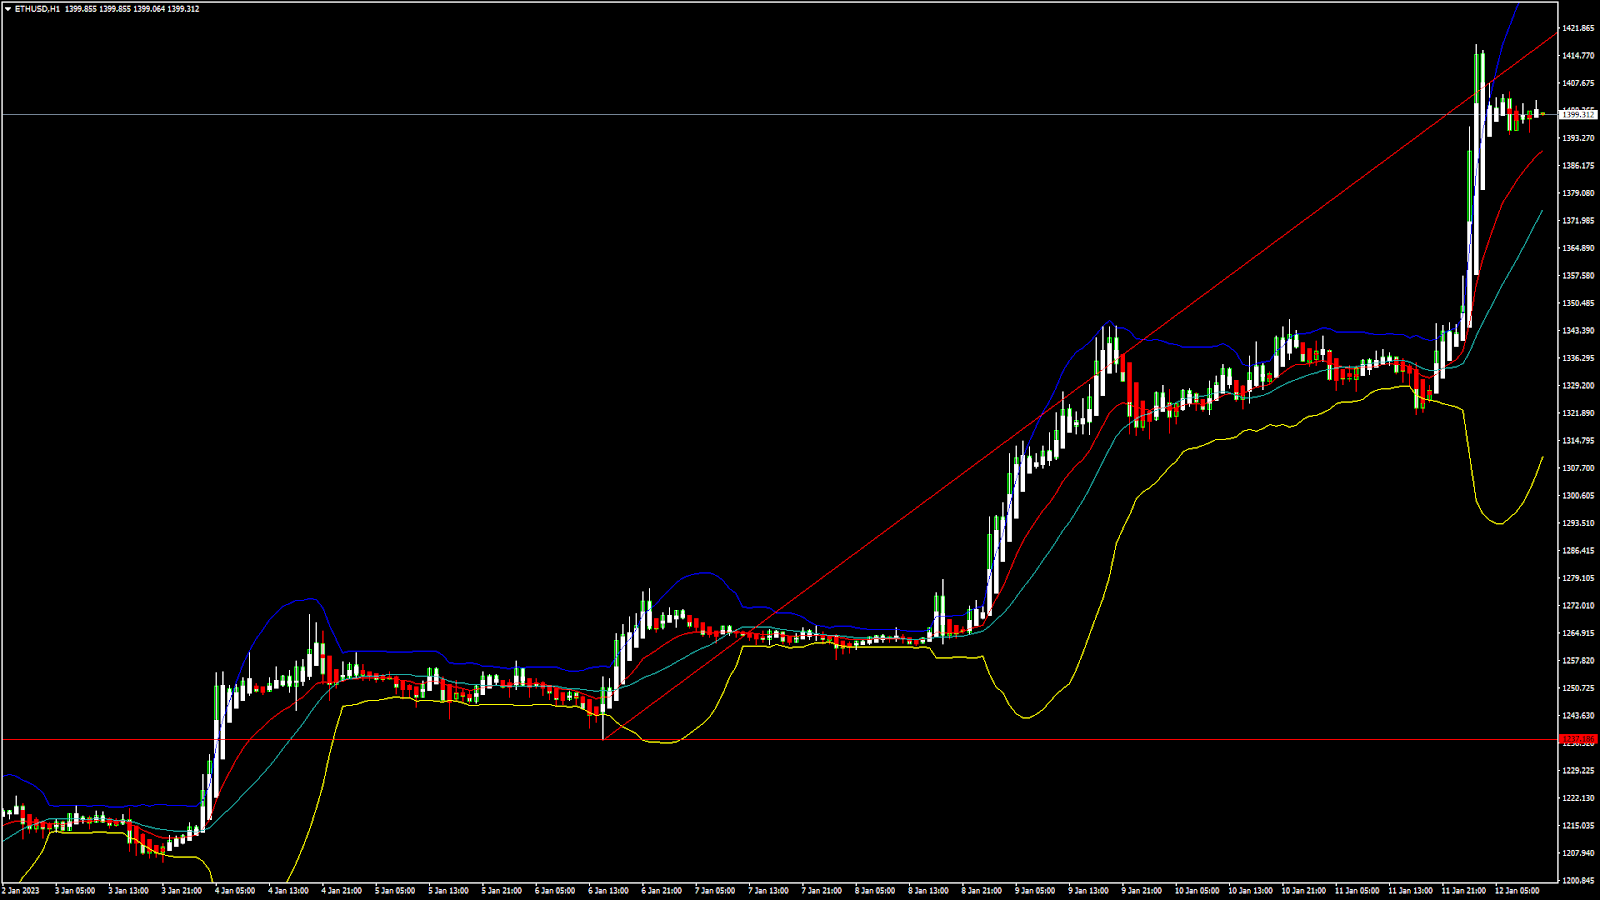
Ethereum was unable to sustain its bearish momentum and after touching a low of 1237 on 06th Jan, the price started to correct upwards against the US dollar crossing the $1400 handle today in the European trading session.
The prices are ranging near a new record high of 1 month.
We have seen a bullish opening in the markets this week.
We can clearly see a bullish harami pattern above the $1237 handle which is a bullish pattern and signifies the end of a bearish phase and the start of a bullish phase in the markets.
ETH is now trading just above its pivot level of 1398 and moving in a strongly bullish channel. The price of ETHUSD is now testing its classic resistance level of 1401 and Fibonacci resistance level of 1403 after which the path towards 1500 will get cleared.
We have also seen the formation of an upside gap in the 15-minute time frame indicating the bullish nature of the markets.
The relative strength index is at 70.66 indicating a strong demand for Ether and the continuation of the buying pressure in the markets.
The Williams percent range is indicating an overbought market, which means that the price is expected to decline in the short-term range.
Most of the technical indicators are giving a STRONG BUY market signal.
Most of the moving averages are giving a STRONG BUY signal at the current market levels of $1399.
ETH is now trading Above both the 100 hourly simple and 200 hourly exponential moving averages.
- Ether: bullish reversal seen above the $1237 mark
- The short-term range appears to be strongly bullish
- ETH continues to remain above the $1350 level
- The average true range is indicating HIGH market volatility ..More info: blog FXOpen
Ether: Bullish Reversal Seen Above $1237