BTCUSD: Bullish Harami Pattern Above $16325
Bitcoin was unable to sustain its bullish momentum and after touching a high of $18360 on 14th Dec, the price started to decline against the US dollar coming down below the $16500 handle in the early Asian trading session today.
The price of bitcoin has since bounced back from its lows touching $16800 levels in the European Trading session today.
We have seen a bullish opening of the markets this week.
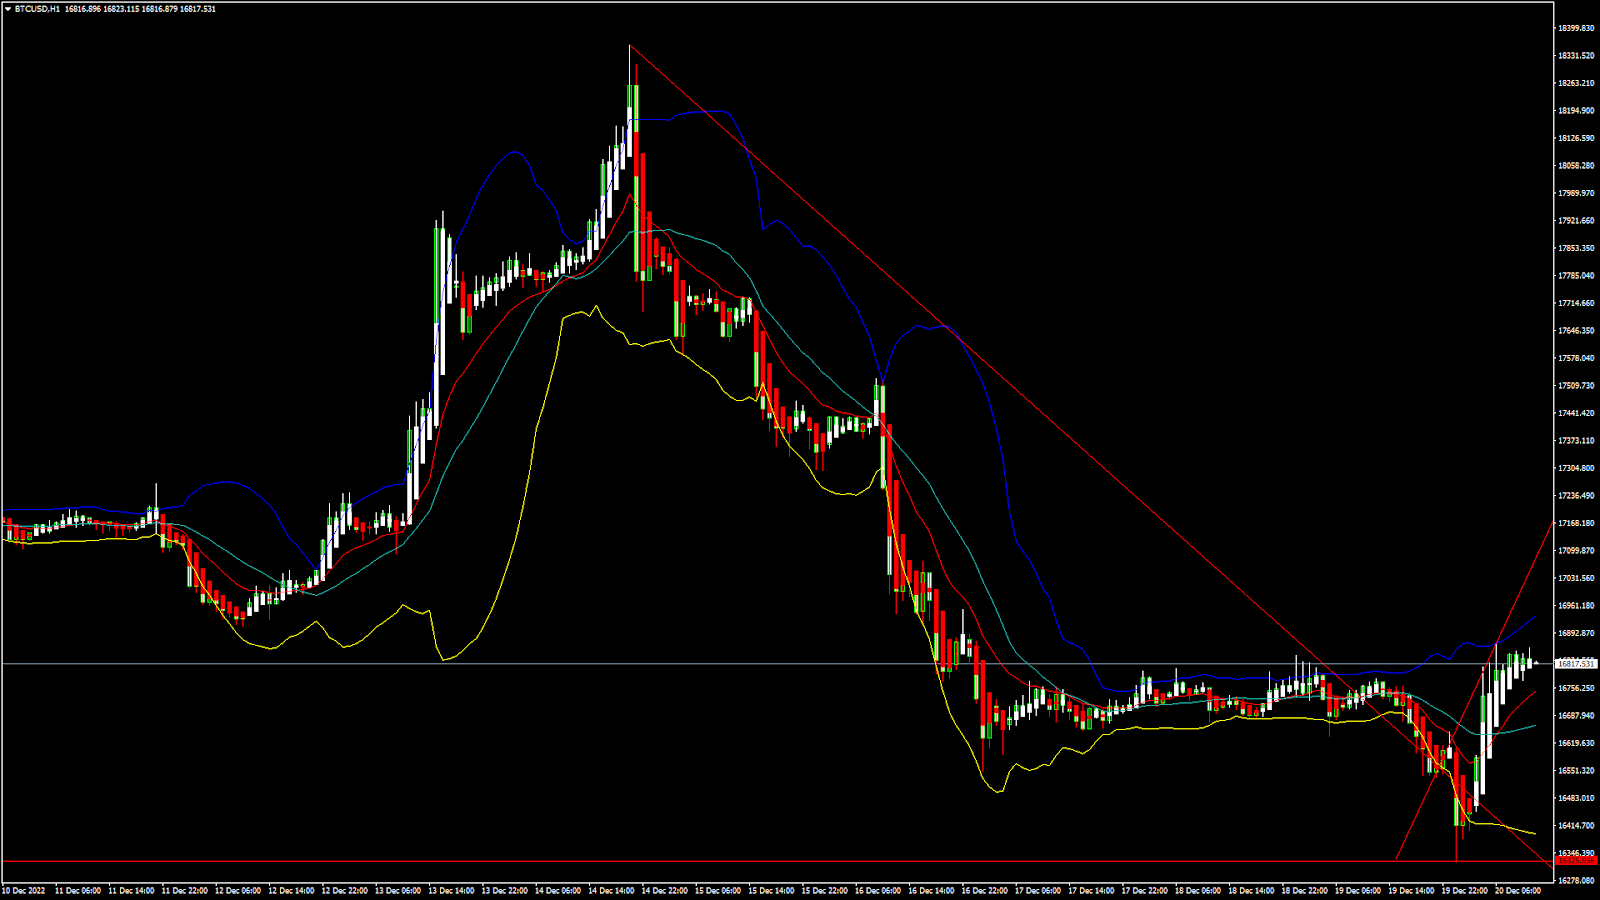
We can clearly see a bullish harami pattern above the $16325 handle which is a bullish reversal pattern because it signifies the end of a downtrend and a shift towards an uptrend.
Bitcoin touched an intraday low of 16322 in the Asian trading session and an intraday high of 16846 in the European trading session today.
We can see the formation of the bullish trend reversal pattern with the adaptive moving average AMA20 and MA20 in the 4-hour time frame.
Both the RSI and STOCHRSI are indicating overbought levels which means that in the immediate short term, a decline in the prices is expected.
The relative strength index is at 75 indicating an OVERBOUGHT level for bitcoin, and the possibility of an immediate correction in the price towards the $16500 levels.
Bitcoin is now moving above its 100 hourly simple moving average and below its 200 hourly exponential moving average.
All of the major technical Indicators are giving a STRONG BUY signal, which means that in the immediate short term, we are expecting targets of 17000 and 18500.
Bitcoin: Bullish Reversal Seen Above $16325...More info: blog FXOpen