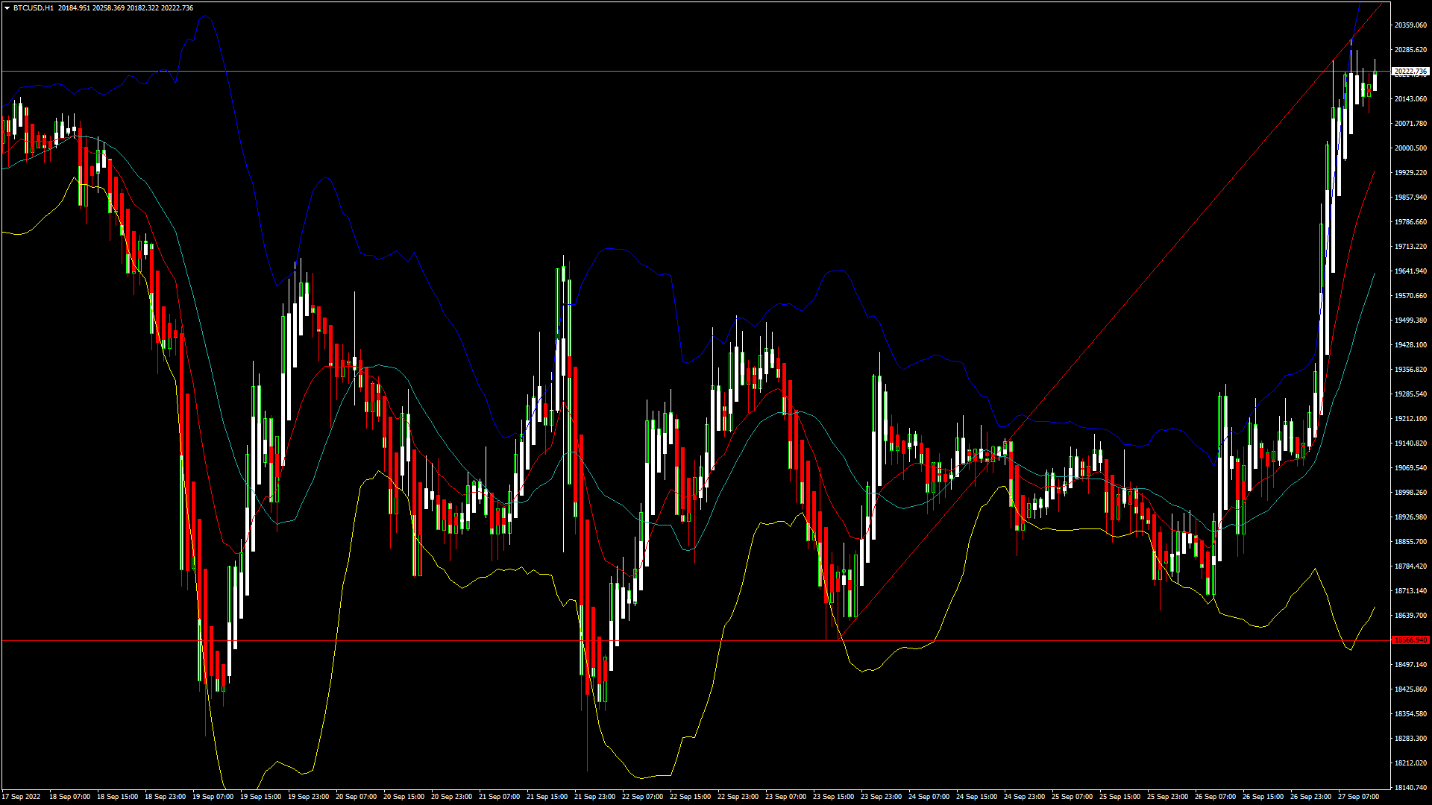
BTCUSD: Double Bottom Pattern Above $18566
Bitcoin was unable to sustain its bearish momentum and after touching a low of 18279 on 21st Sep, the price has continued to escalate upwards and crossed the $20000 handle today in the European trading session.
This upside break was long overdue and now marks the beginning of rebound towards the $25000 level.
We can see the formation of bullish engulfing lines in the 15-minute and weekly time frames.
The momentum indicator is back over zero indicating a bullish scenario in both the 30-minute and daily time frames.
We can clearly see a double bottom pattern above the $18566 handle which is a bullish reversal pattern because it signifies the end of a downtrend and a shift towards an uptrend.
Bitcoin touched an intraday low of 19097 in the Asian trading session and an intraday high of 20310 in the European trading session today.
Both the STOCH and STOCHRSI are indicating overbought levels which means that in the immediate short term, a decline in the prices is expected...More info: blog FXOpen