Today I created a multi-scale RSI indicator.
I have been thinking a lot about how to composite the RSI indicator for a few days. I share one of those ideas here.
First Step.
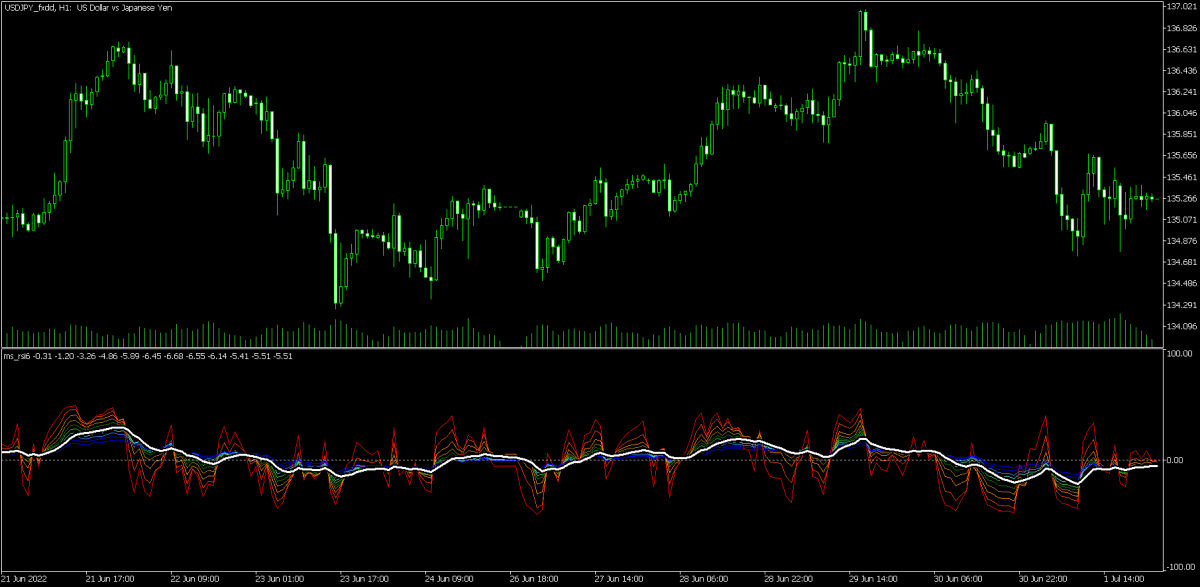
First, I displayed the RSI for all periods in the same sub-window and output the composite value.

Red is short periods and blue is long periods. As you can see, they do not work well because they cancel each other's features.
Second Step.
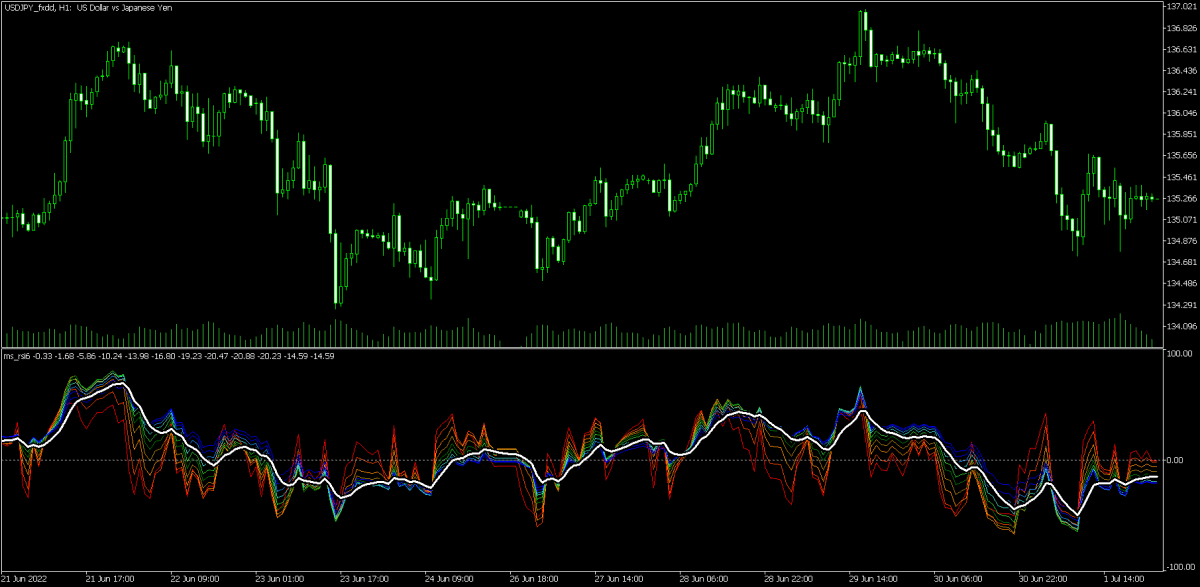
The amplitude of the RSI decreases as the period increases. To adjust for this, we amplified the signal of the long-term RSI.

I tried various amplification rates but finally settled on this result. It's a pretty good result.
Final Step
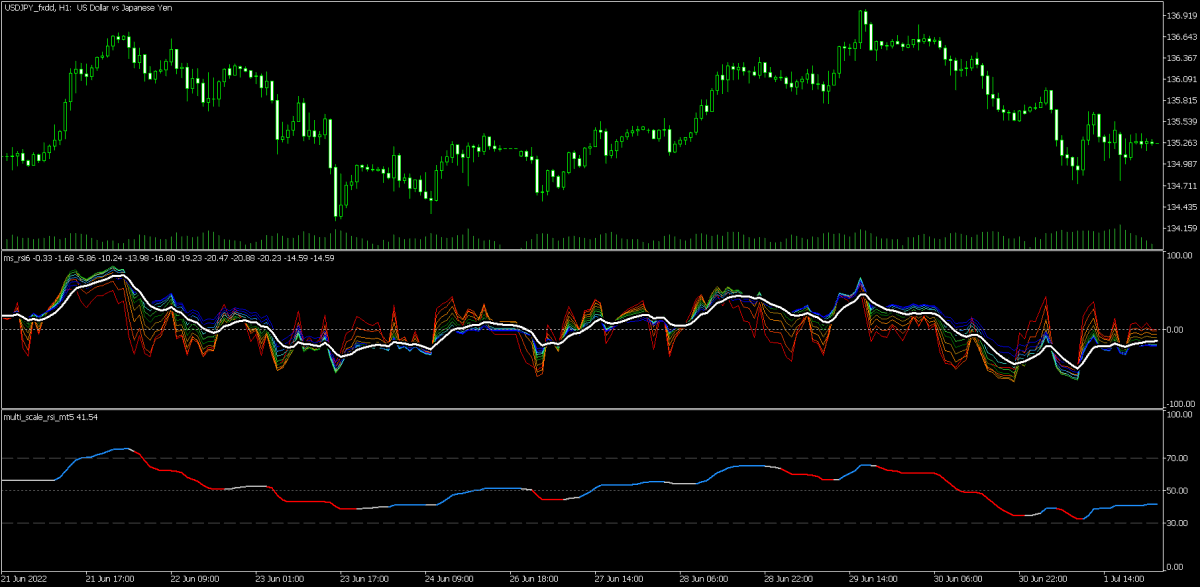
As it is, there is a lot of noise, so we smoothed it out and divided it into three colors. 
How was it?


