Master Point Indicator: User guide
So what is the Master Point Indicator? Here's the description from the mql5 market:
https://www.mql5.com/en/market/product/82393
Master Point is an indicator set that includes the most powerful and necessary tools for a trader, giving that very edge in the markets to be successful. The indicator has a complex system for analyzing the market for reversal/trend patterns. It has tools such as trend reversal detection, pivot points, divergences, currency strength and 'candle strength'. All this makes the indicator a complete tool that does not require any other indicators!
So it's a powerful and complete system that gives intelligent technical analisys and good trade entry signals.
TIMEFRAMES: SUITABLE FOR M15-H4 || WORKS WITH CURRENCIES, INDEXES, STOCKS, CRYPTOS
Indicator's elements:
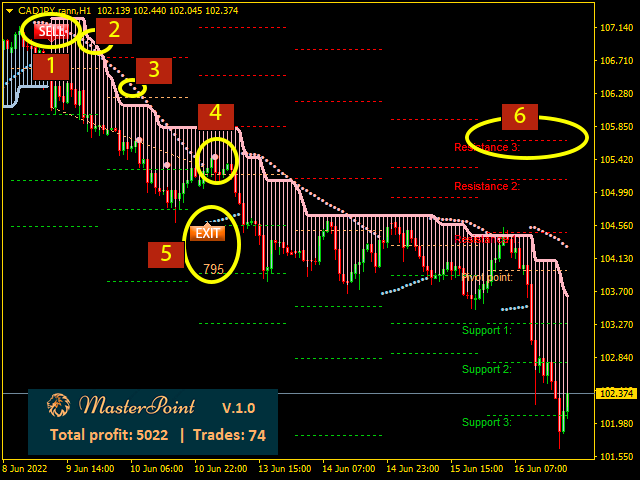
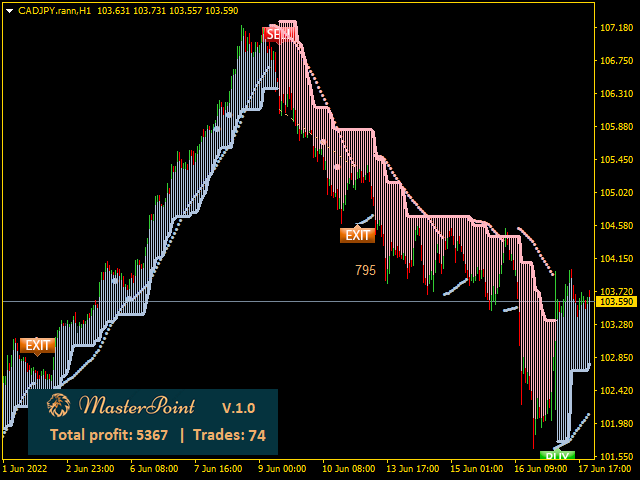
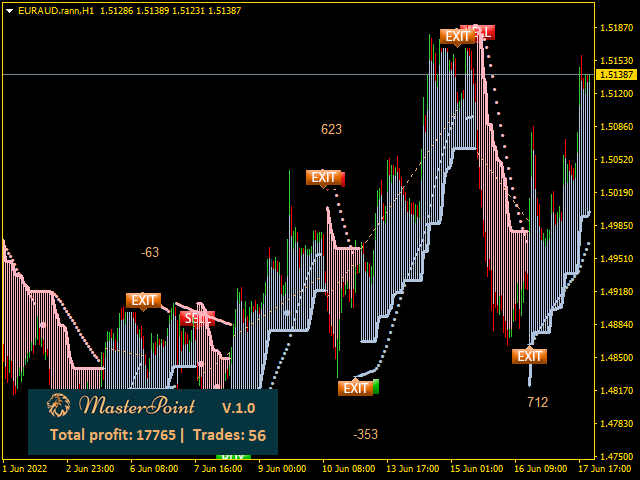
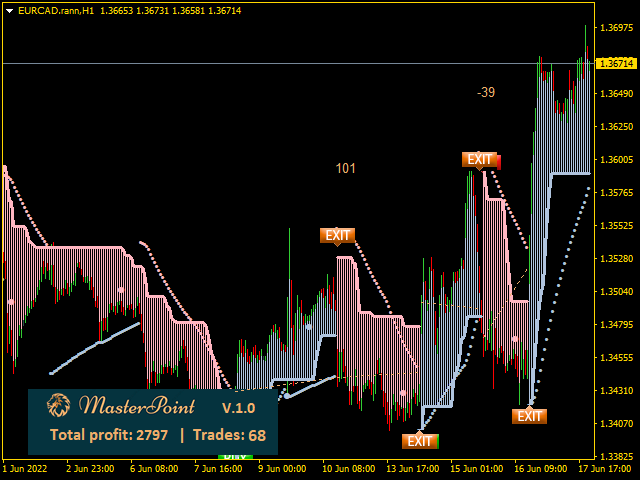
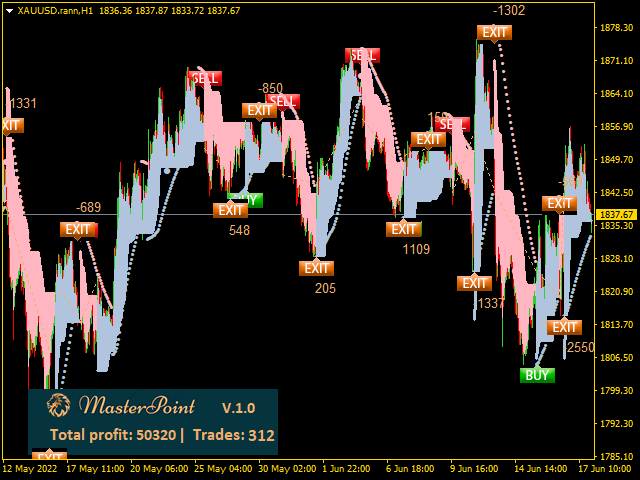
1. Signal mark- shows recommedation where to buy or sell.
2. Trend Cloud- shows bullish/bearish trend. The boundaries are used as recommendation for stop-losses.
3. Sar lines- Parabolic Sar line helps to determine an upcoming trend reversal (used for entries, and for closing trades)
4. Signal bar- a special bar (divergence, price action), that confirms a direction of a new trend.
5. Exit label- label that shows a good point for closing trades.
6. Pivot points- support and resistance levels that can used for closing trades.
How to trade:
Depending on a currency and on timeframe, there're mainly three strategies that can be used for good entries
Important. Never enter a trade too late in a trend. Enter only when a new trend has just formed and a new signal has appeared during the first 10 bars of a change trend.
EXAMPLE:
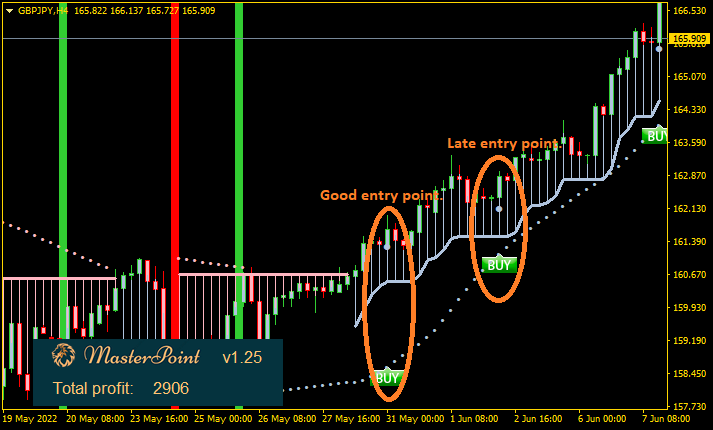
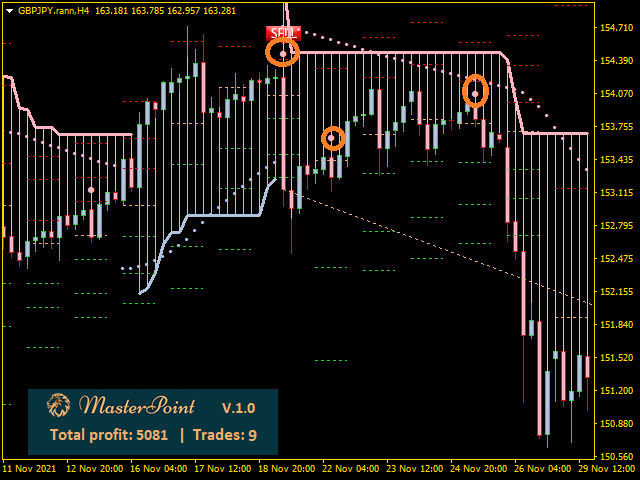
1) You open a trade when the trend cloud changes its color (blue to red and vice versa) and Sar becomes bullish/bearish. Works very well on pairs with long trends (for example, currencies paired with JPY).
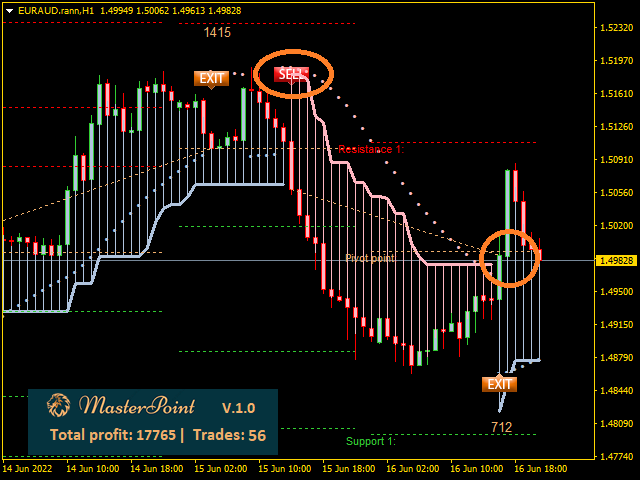
b) Open a trade on a new signal bar. After a new trend emerges (trend cloud changes it's color), wait until a signal bar appears and then open a trade. Signal bars work very well on the higher timeframes as it uses divergence and price action strategies.
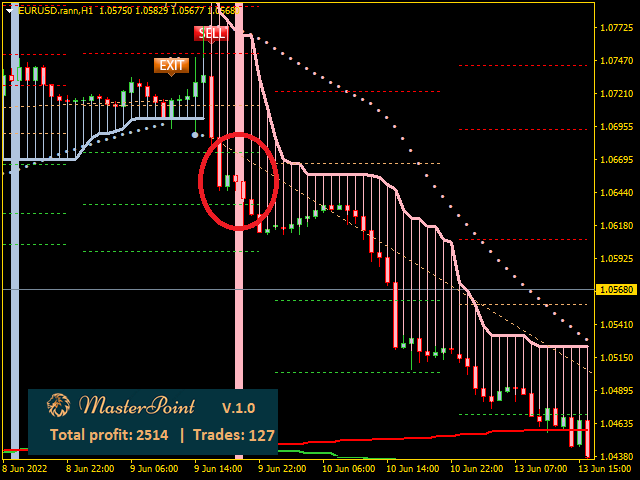
3) Open a trade using currency strength lines. A very powerful and profitable strategy if you use the currency strength indicator. Whenever the currency strength lines cross (also marked with vertical rectangles), it symbolizes a change in trend. With a trend cloud, the strategy creates excellent entry points. It is strongly recommended to use currency strength lines from higher timeframes (for example, your active chart is on H1 timeframe, but you are using currency strength lines from H4 timeframe).
Which options to choose: It's all depends on a currency pair. For example XAUUSD works very well with signal bars, that is with price action and divergence.
On other hand CADJPY can be easily traded using the trend clouds. Information on the dashboard will say what is profitable, and what is not for a choosen pair.
How to exit trades:
As with the entry points there are two options of how you can exit your trades:
1) Pivot levels - levels can be used as points where you can close trades partially or completely. It is highly recommended to use with major pairs such as GBP/USD and EUR/USD as these pairs can be very volatile.
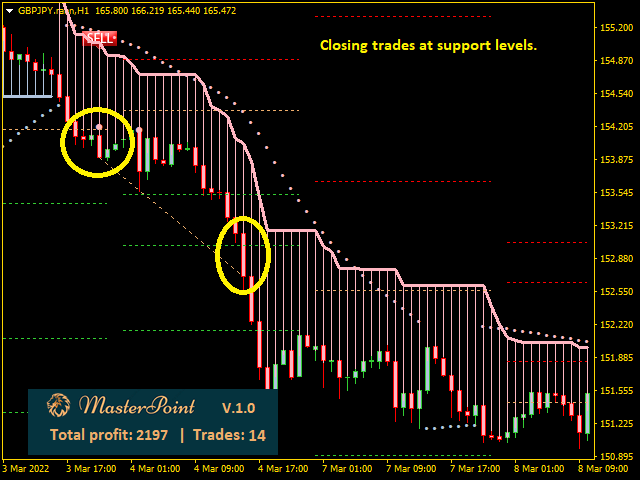
2) Parabolic Sar- the line signals a probabale trend change. So whenever the indicator changes to bullish or bearish, it's recommended to close a trade completely.
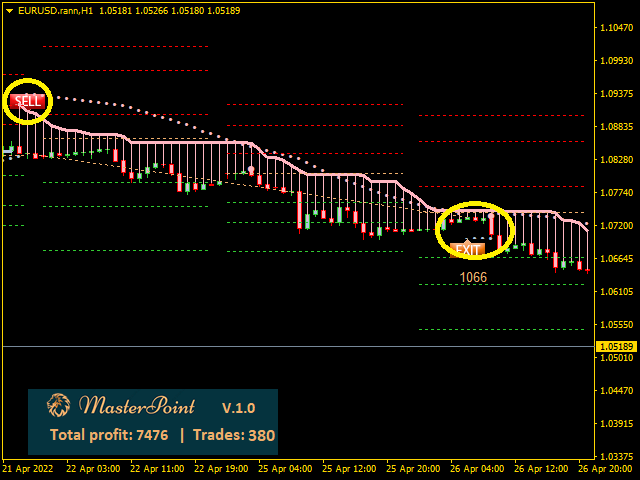
The indicators profit dashboard will show what exit strategy is more profitable, since the indicator has an option to show profit depending on a chosen exit strategy. (more informaton in the ''Inputs description').
The description of the inputs:
Notification Settings
Minimum break (seconds) for alert:after how many seconds the indicator can send another alert.
Notify type for a trend change:type of notification when trend cloud changes it's color.
Notify about a signal bar:type of notification when a signal bar appears.
Notify about a currency strength cross:type of notification when currency stregth lines cross.
Indicator Settings
Sensitvity: The higher the value, the less market noise, but also the fewer transactions.
Show pivots levels:enable pivot level lines (support and resistance)
Pivot points hour shift:if your broker uses GMT standart (EET/EEST) times, when nothing should be changed in this input. However, if your broker uses GMT 0 for example, when shift should -2 during winter time, and -3 during summer time.
Currency Strength Settings
Enable currency strength:enable currency strength lines.
Currency strength prefix: if your broker uses prefix for the currency pairs, then it should be specified here. For example, if the broker specifies EURUSD pair as 'cent.EURUSD' then 'cent' should be typed here.
Currency strength suffx:same as with prefix, if your broker uses suffix it should be specified here.
Currency strength timeframe: what timeframe will the currency strength data be taken from?
Currency strength count bars:maximum bars from the chart can be used for the currency strength indicator.
Visual Settings
Visual theme:color theme for the chart.
Main buy color:color for bullish cloud, sar and signal bar.
Main sell color:color for bearish cloud, sar and signal bar.
No signal color:color for profit lines, and pivot lines.
Pivot/currency strength buy color:color for support lines.
Pivot/currency strength sell color:color for resistance lines.
Profit tags offset(points):offset in points from the 'buy'/'sell' labels on the chart.
Profit calculator
Caclulate profits:enable profit calucalation.
Calculate trades only for the first N bars:used only when 'signal bar' entry strategy is used. If 'Buy'/'Sell' value appears after specified bars then, the recommendation to buy or sell wll be skipped.
Entry point type: for which type of strategy the indicator should calculate profits.
Which pairs are recomended for this pair.
Pairs that generally range well, such as EUR/USD, GBP/JPY, USD/JPY, EUR/AUD, CADJPY, AUDJPY, XAUUSD and so on. H1 is a standart time. Stocks and crypto also work exceptionally well with Master Point.
