
BTCUSD – Bearish Harami Pattern Below $28300
Bitcoin continues its bearish momentum from last week and plunged below the $21000 handle touching a low of 20850 in the European Trading session today.
The global investor sentiments are weak and the continuation of the selling pressure across the global cryptocurrency exchanges is causing the massive slide in Bitcoin.
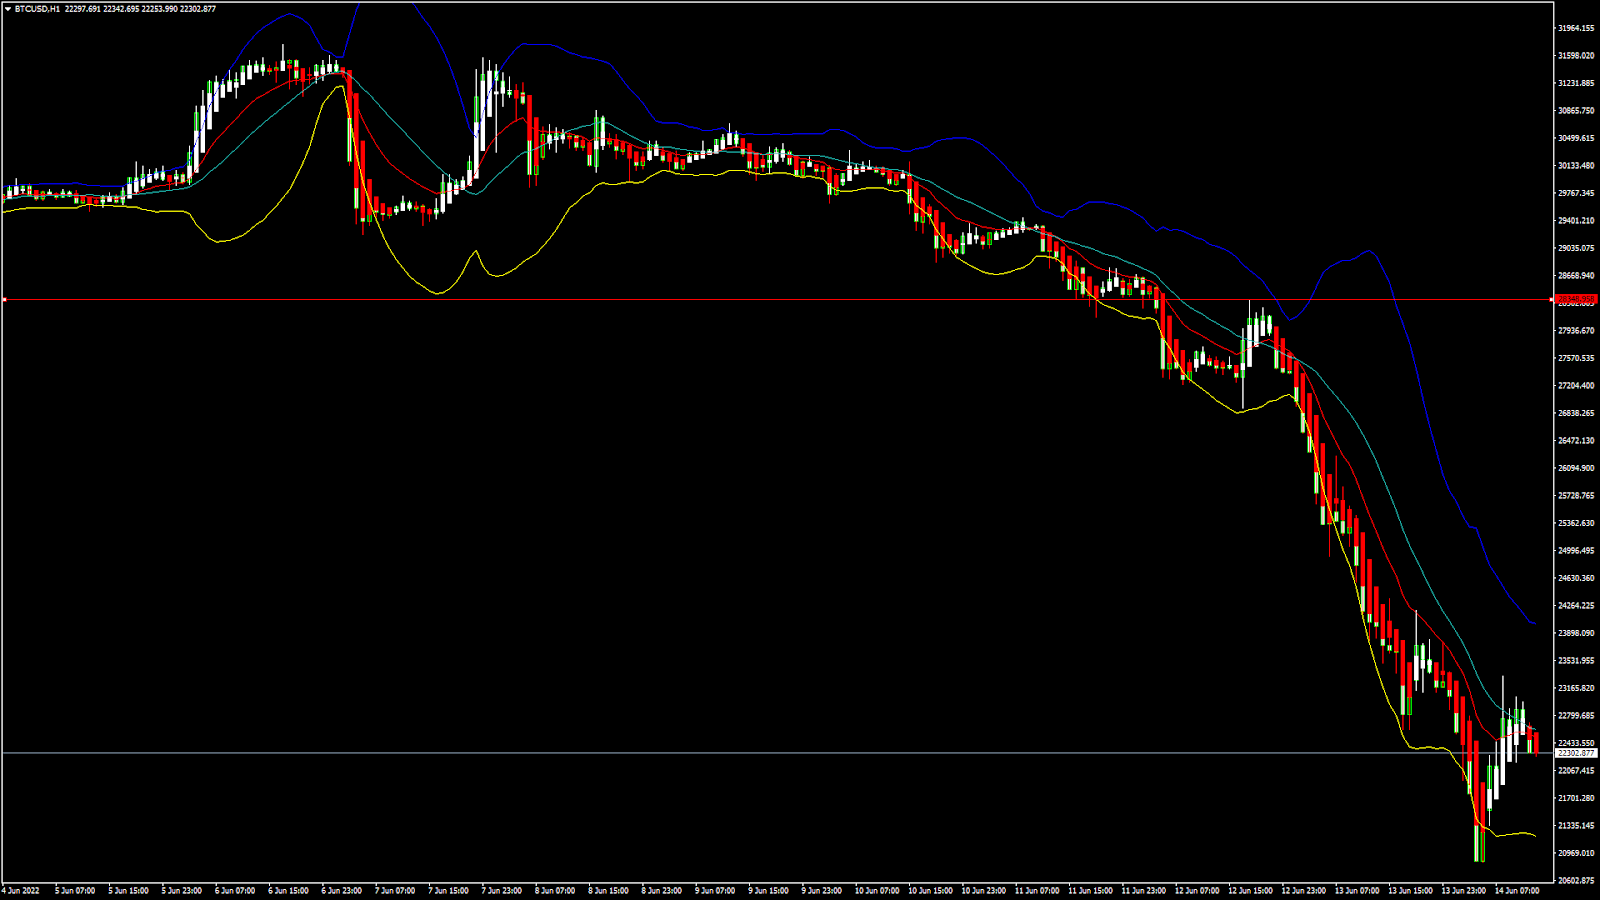
Bitcoin entered into a Major Bearish trend channel below the $28300 handle and continued to decline below the $21000 handle today, the lowest level seen in 2 years.
We can see a very weak demand for the Bitcoin in the medium-term range and the prices are expected to fall further towards the $20000 levels.
We can clearly see a Bearish Harami Pattern Below the $28300 handle which is a Bearish reversal pattern because it signifies the end of an Uptrend and a shift towards a Downtrend.
Both the STOCH and Williams Percent Range are indicating Overbought levels which means that in the immediate short term a decline in the prices is expected.
Relative Strength Index is at 40 indicating a WEAK demand for the Bitcoin at the current market levels.
Bitcoin is now moving Below its 100 hourly Simple Moving average and its 200 hourly Simple Moving averages.
All of the Major Technical Indicators are giving a SELL Signal, which means that in the immediate short term we are expecting targets of 21000 and 20500.
Average True Range is indicating LESS Market Volatility with a Strong Bearish Momentum...More info: blog FXOpen


 & AMD Framework")