
Bollinger Bands Breakout Strategy Arrows and Scanner Dashboard

Product page:
https://www.mql5.com/en/market/product/78178
Video Tutorial:
Bollinger Bands Breakout Strategy has an Arrows and Scanner Dashboard indicator set. It is for MT4 (Metatrader 4) platform.
When price breaks out of a Bollinger Outer Band in a powerful way, it becomes a great position for scalping.
Because the next few bars will most likely keep going in the same direction.
Especially if Middle band is also sloping towards that breakout.
It's also great for Binary options when using 2-3 next few bars.
Strategy:
BUY Bollinger Bands:
- Price breaks out of Bollinger Bands Upwards (Main Signal)
- Breakout Boll Band is sloped upwards above Slope Threshold value (customizable)
- Opposite Boll Band is sloped downwards below Slope Threshold value (customizable)
- Middle Band is sloped upwards (customizable)
All other checks are optional
- BB Squeeze right before breakout within specified number of bars
- Breakout Candle has a Strong Volume
- CCI/RSI goes overbought
- Waddah is Green and explosive
- HTF and Current TF Trend Check using NRTR
Same but vice-versa for SELL
Features:
- Bollinger Bands Breakout
- CCI/RSI/Stoch
- Waddah Explosion
- NRTR Trend Check
- Max Spread Check
- Fixed Stop Loss and Take Profit Option
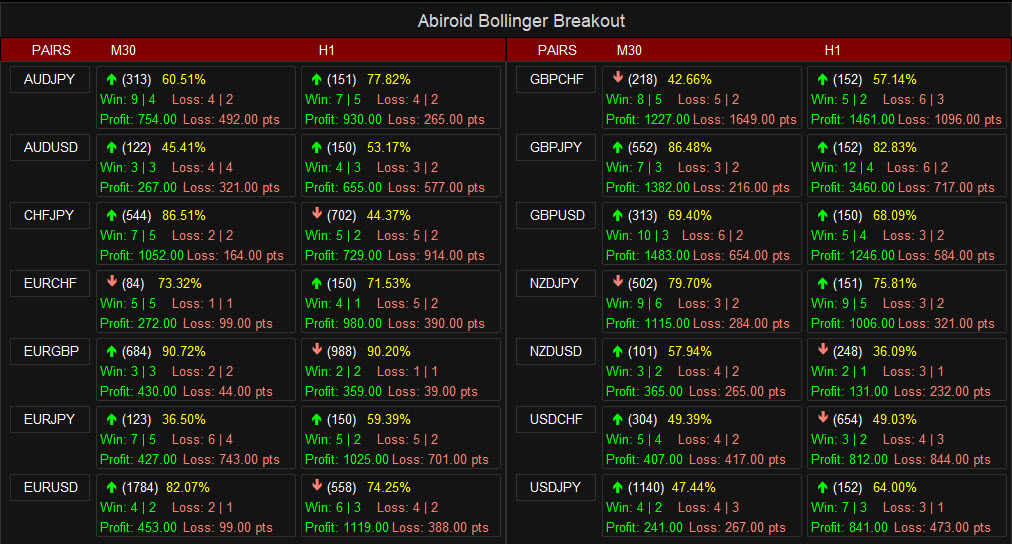
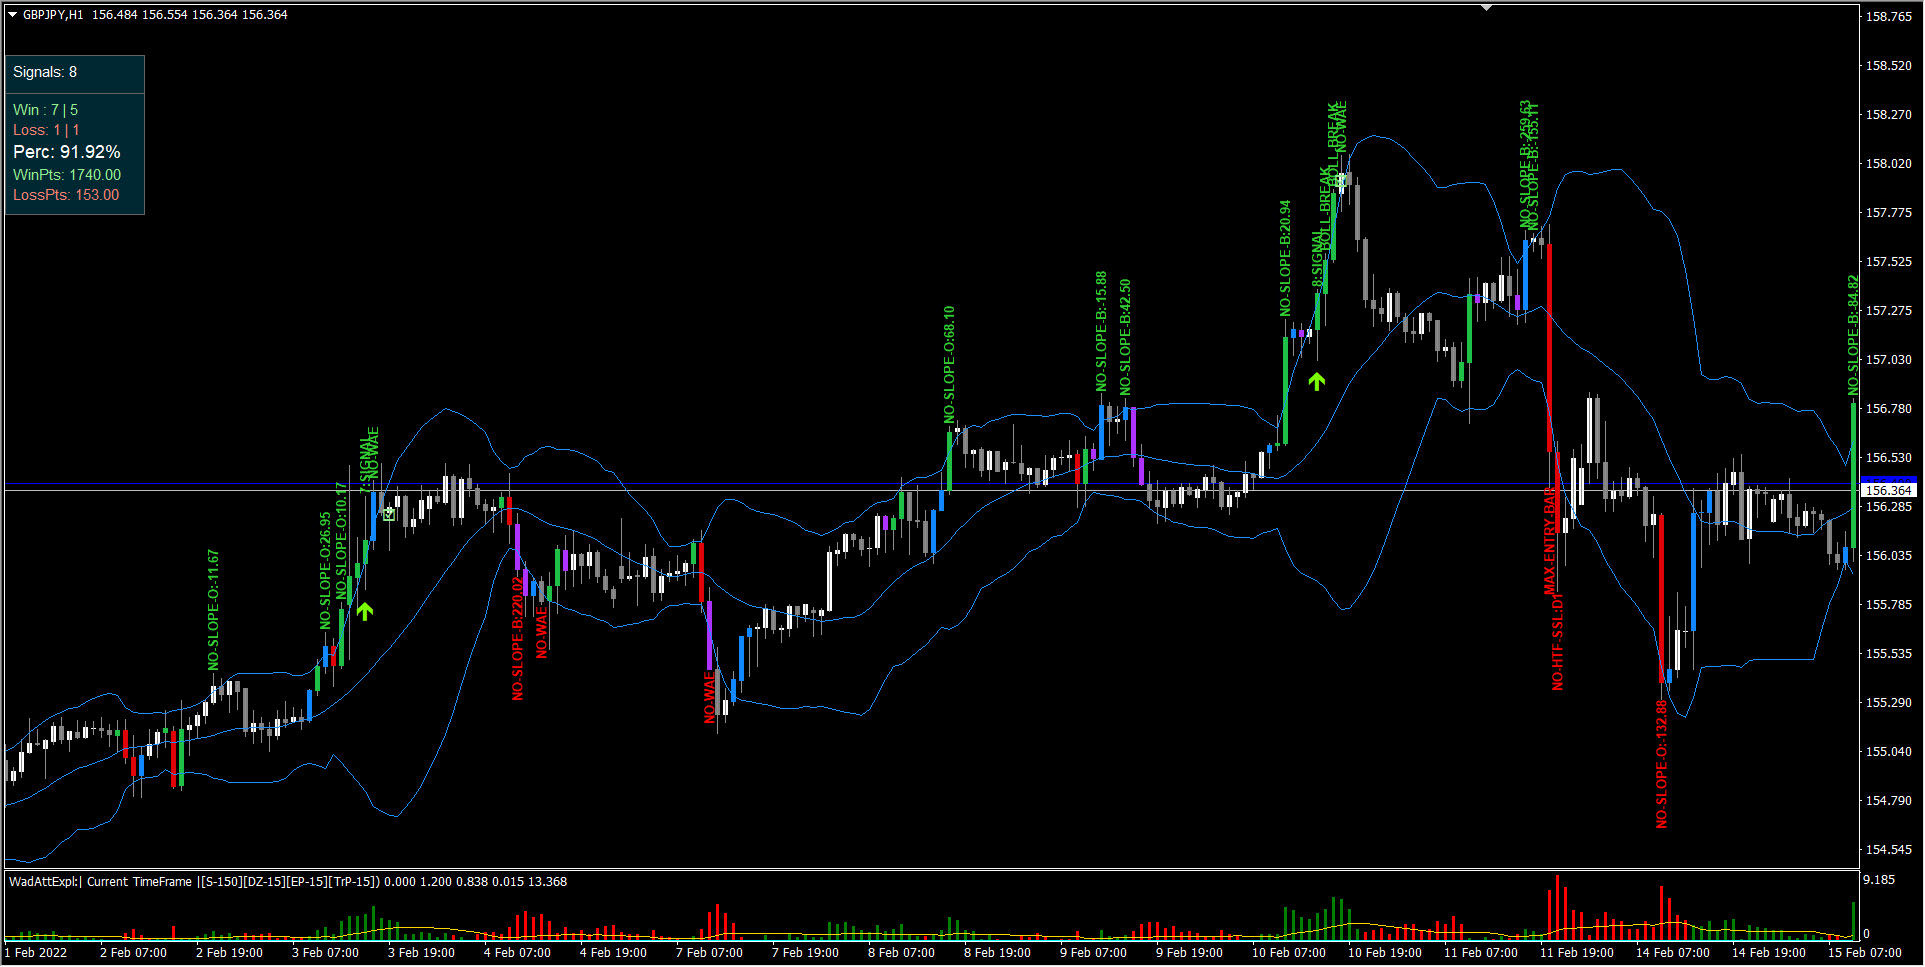
- Calculation of Profit Loss Points and Win/Loss Count and Profit Percentage
- Debug Texts on bars to show why signal skipped
Free Downloads:
Attached with this post are the extra indicators for VolumeCandles.ex4, Waddah, NRTR.
For RSI, CCI, Stoch or Bollinger Bands use the MT4 in-built indicators.
Free Scanner
https://abiroid.com/download/abiroid-bollinger-breakout-scanner/?tmstv=1733859686
Arrows Demo:
https://abiroid.com/product/bollinger-bands-breakout
Demo only works for Arrows indicator on EURUSD or USDJPY or AUDUSD.
Scanner needs the Arrows ex4 to work.
Please note that Bollinger Slope is calculated using indicator:
https://abiroid.com/product/abiroid-bb-slope-bollinger-bands
You DO NOT need this indicator. It will be used internally by Arrows indicator.
But if you need to see the Bollinger Slope Histogram on your chart, then you could purchase it if you like.
To run this Bollinger Breakout Strategy, this slope ex4 file is not needed :)
How it Works:
Bollinger Bands (Main Signal):
It is an MT4 in-built indicator. It uses a simple moving average of 20 periods, and plots upper and lower bands that are 2 standard deviations away from the basis line.
These bands help visualize price volatility.
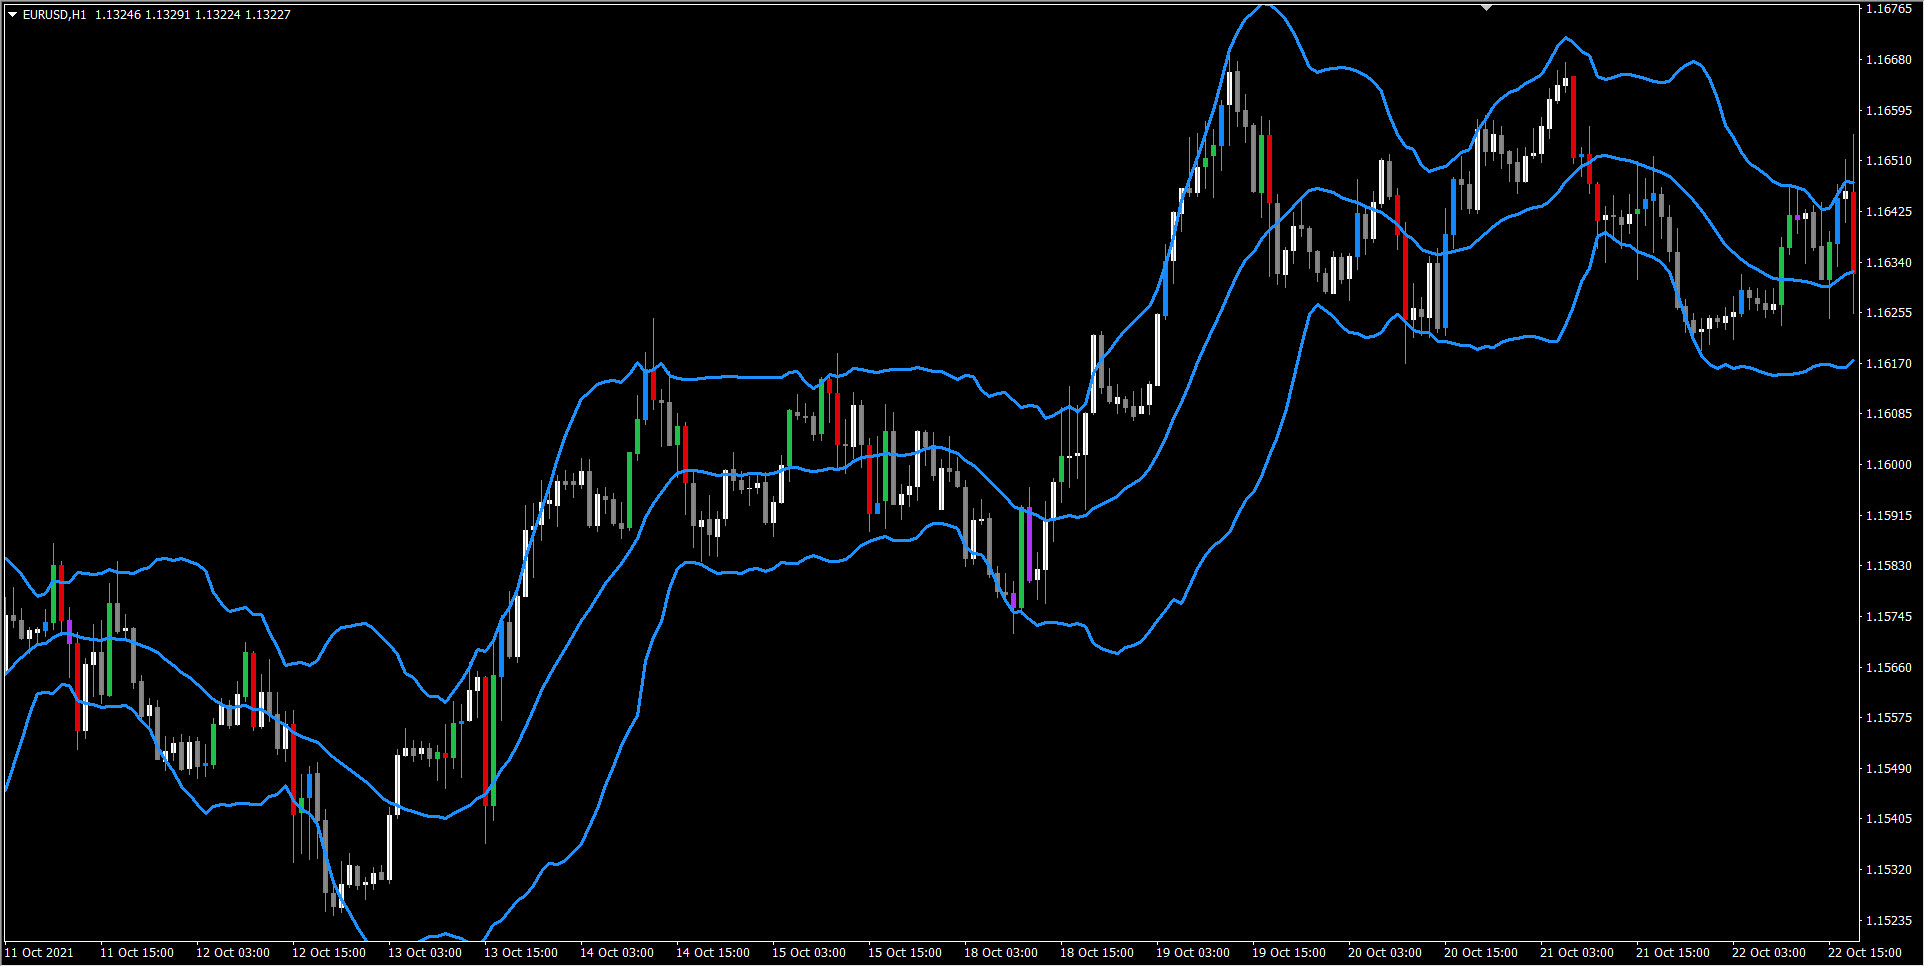
If a candle breaks out of a bollinger band, then price usually reverses if bands are spread apart.
But if the breakout happens right after a bollinger squeeze, then price will most likely keep going towards the breakout. For the next few bars.
A bollinger squeeze is when price consolidates in a tight range:
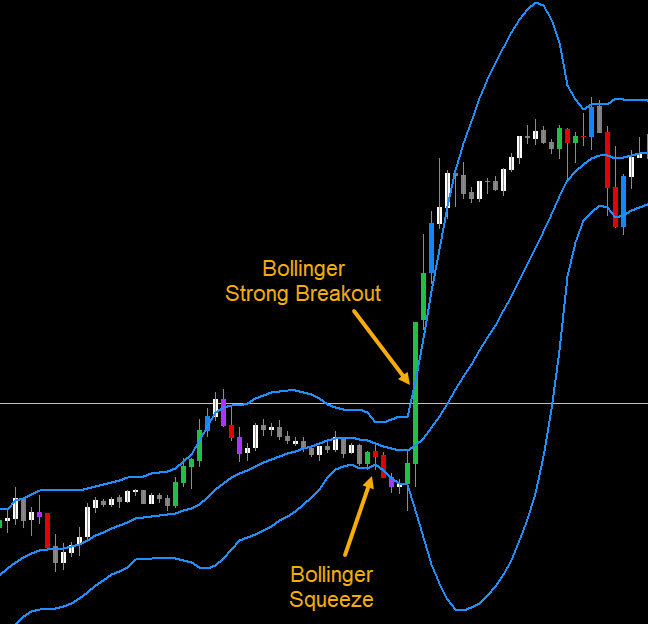
And a strong breakout right after a tight squeeze is best type of signal.
This Arrows indicator will look for Bollinger bands separation, by checking the slopes for:
- Breakout Band (the band where price broke out)
- the middle band
- the opposite band (band opposite to breakout band)
All slope Threshold values that you input should be positive values. The Indicator will automatically check for negative values based on which band the price is breaking out of.
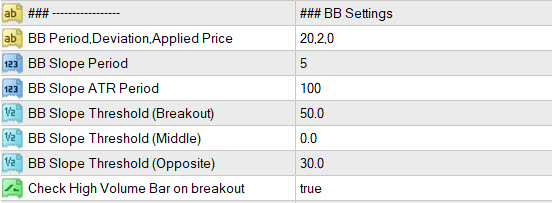
Suppose BB Slope Threshold (Breakout) is 50. Then for BUY, it will check if slope is more than 50. For SELL, it will check if slope is less than -50.
And if BB Slope Threshold (Middle)is 10. Then for BUY, it will check if slope is more than 10. For SELL, it will check if slope is less than -10.
If BB Slope Threshold (Opposite) is 30. Then for BUY, it will check if slope is less than -30. For SELL, it will check if slope is more than 30.
Because we want the opposite band to open up in reverse direction to the breakout band.
The steeper the Breakout Band slope, the farther the price will most likely move. It will depend on pair volatility. But keeping it too steep will be very restrictive. It will give better signals, but very few. For example:
BB Slope Threshold (Breakout) 90
BB Slope Threshold (Opposite) 50
will be very restrictive.
For Bollinger band itself, specify "Period,Deviation,Applied Price"as comma separated values. Applied price values are:
https://docs.mql4.com/constants/indicatorconstants/prices
" BB Slope Period" and " BB Slope ATR Period" are for slope generation. Keep default if unsure.
If you want the breakout candle to be High Volume candle, keep " Check High Volume Bar" true.
It uses VolumeCandles.ex4 to find high volume bars. And it uses the Green/Red volume bars.
BB Squeeze:
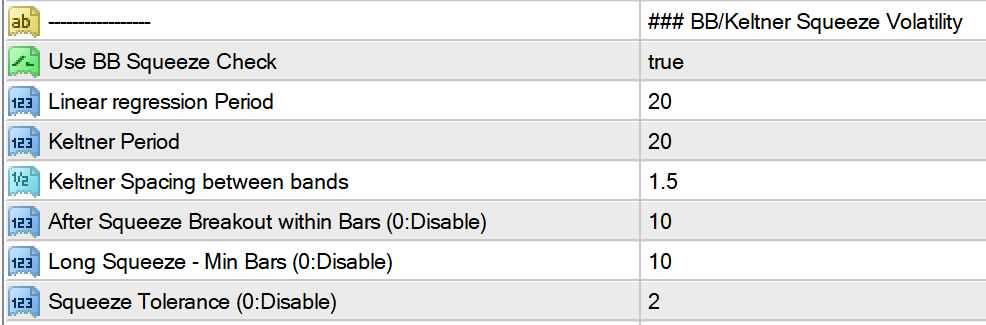
If this check is true, then it will check "After Squeeze Breakout within Bars" number of bars.
Suppose this is 10, then before breakout, there should have been a BB Squeeze (red dots) at least 10 or less bars back.
And if long squeeze is defined as 15, then that BB Squeeze (red dots) should have been at least 15 bars long.
If Squeeze Tolerance is 2, then during BB Squeeze, even if there are 1 or 2 green dots, it will still be considered as a valid squeeze.
Something like this:
It calculates Bollinger Squeeze using bbsqueeze_dark_alerts 2.01.ex4
Attached with this post. And it uses the in-built Bollinger indicator and Simple moving average to calculate the Squeeze. As the in-built bollinger uses SMA also.
It does not support Custom variations for deviation calculations. So set your "bbsqueeze_dark_alerts 2.01.ex4" according to the exact same Keltner settings as you use in Bollinger Breakout Arrow.
Win Rate Calculations:
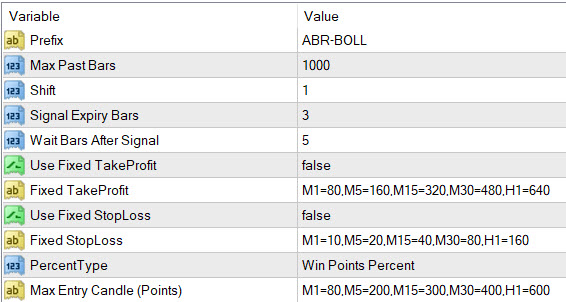
This Indicator will by default use Signal Expiry Bars to check for win/loss. Or you can also specify fixed SL/TP.
Check out this post to read more about Win Rate and other common Scalper settings:
https://www.mql5.com/en/blogs/post/748037
This indicator doesn't have variable SL/TP or TP_Ratio. Because it is more focused on Scalping and binary options.
Max Entry Candles:
Max candle length for breakout candle. So that we can ignore candles that are too large and price has already gone too far and might retrace.
Use Crosshair tool to calculate best candle heights in Points:
https://www.mql5.com/en/blogs/post/747462
Other Settings Explained:
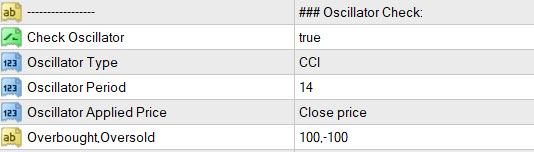
If price is already Overbought/Oversold, it gives even strong signal. Use Ocillators CCI or RSI or Stoch to check for Overbought or Oversold.
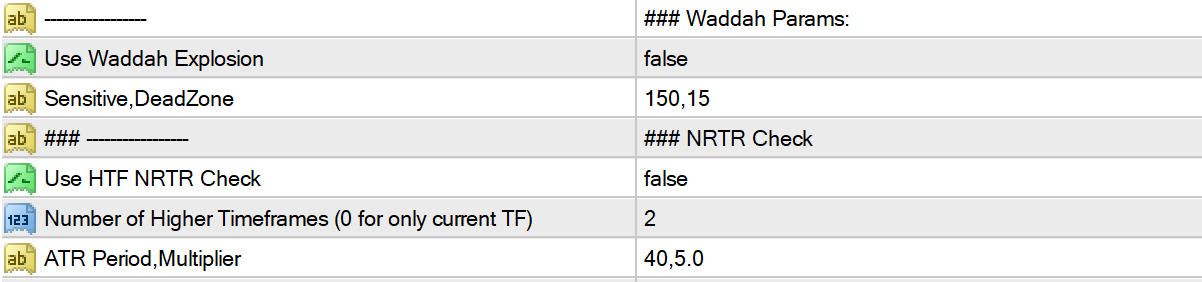
Waddah:
Strong Waddah Explosion also means strong signal. Uses waddah-attar-explosion_Abiroid.ex4
NRTR:
For Current and higher timeframes trend check, it uses NRTR trend check
Number of Higher TF:If you specify 0, it will only check current timeframe.
Or else suppose current is M15 and number is 2. It will check NRTR Trend on current M15 and higher M30 and H1.
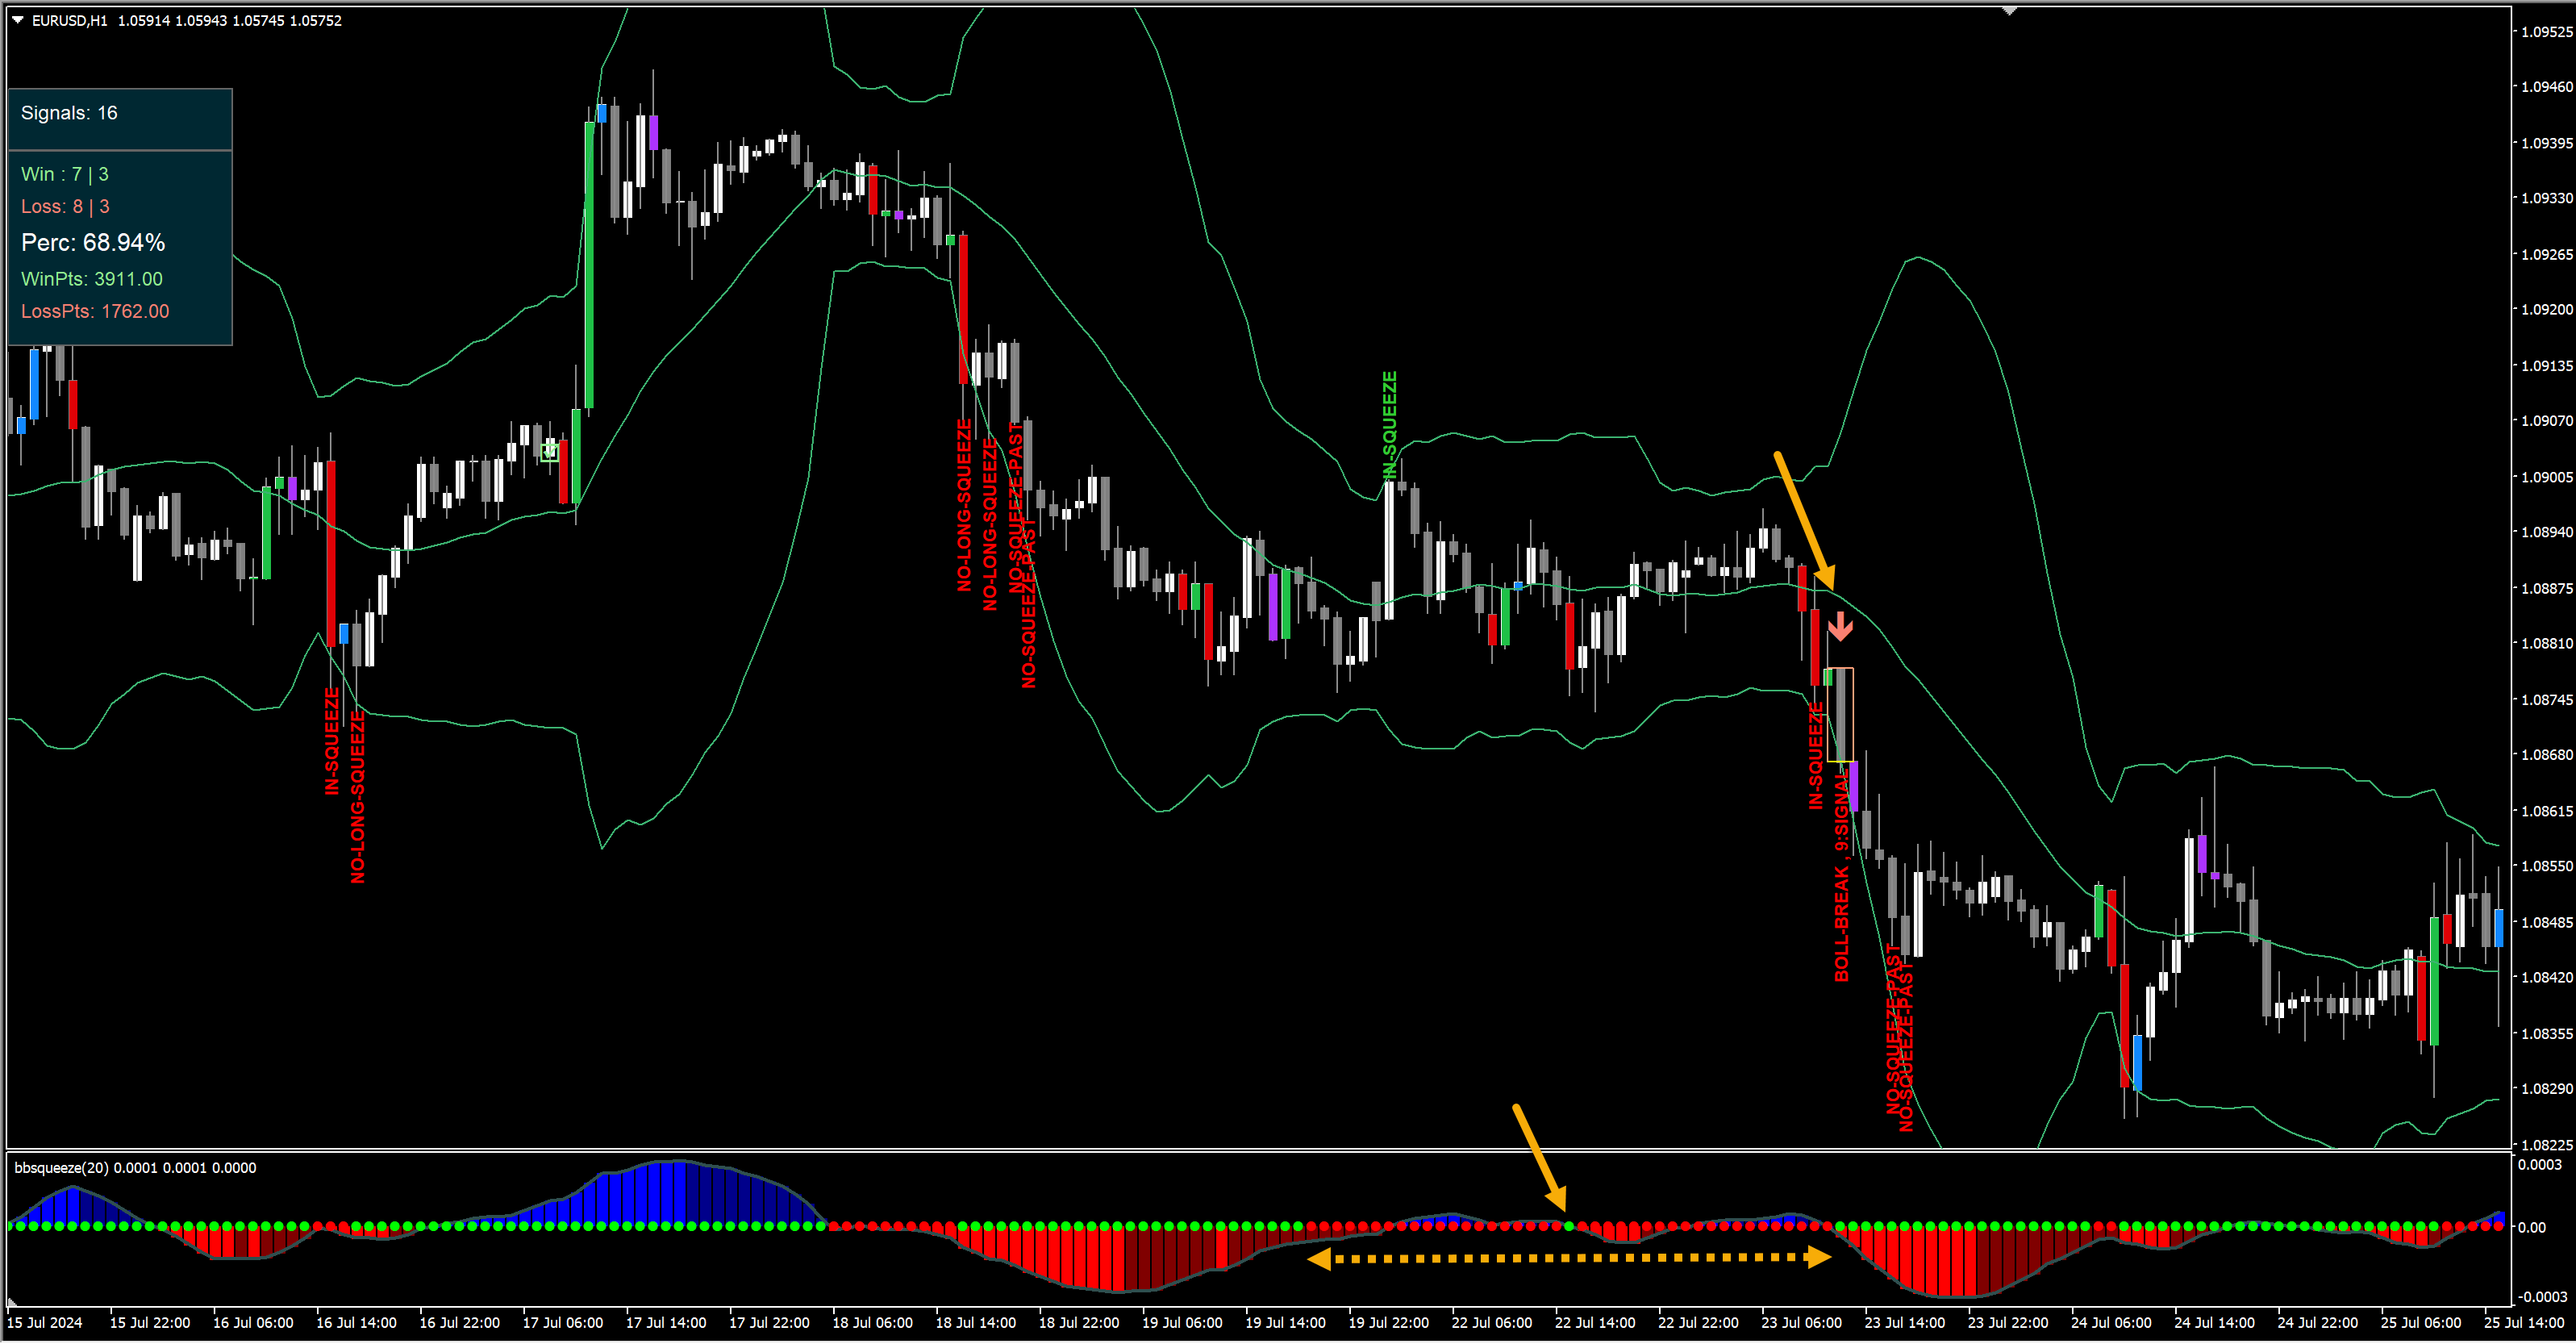
Debug Messages:
Debug messages show what’s happening behind the scenes :)
The green messages indicate that the signal was BUY and red messages indicate that the signal was SELL.
This message is the only one which shows that a signal has happened:
- BOLL-BREAK
There is a bollinger bands breakout
- NO-SLOPE-B or NO-SLOPE-M or NO-SLOPE-O
Slope of Breakout/Middle/Opposite band is not above their respective threshold
- NO-VOL
High Volume not there
- MAX-ENTRY-BAR
The entry (breakout bar) height is more than Max points defined for that timeframe
- NO-WAE
Waddah High Explosion not there
- NO-OSC
Oscillator not Overbought/Oversold for BUY/SELL
- NO-NRTR-x
NRTR Trend not aligned BUY/SELL for timeframe x. Timeframe current will be NO- NRTR-C other higher timeframes will be NO-NRTR-H1 etc.
How to Trade:
Best signals are the ones right after a tight bollinger squeeze. Try trading on at least M5+
M1 can have unpredictable price movements. Best timeframe is M15 or M30 for scalping.
Be Careful:
Don't trade if price has been moving too erratically like whipsaws. Which might be possible during news events etc.
Also be careful during low volatility. Because only high volume and high volatility signals give good results.


")
![[XAUUSD]: Weekly Liquidity Activation Points (timings), June 22-26, 2026](https://c.mql5.com/6/1013/splash-preview-771790.png "[XAUUSD]: Weekly Liquidity Activation Points (timings), June 22-26, 2026")
