

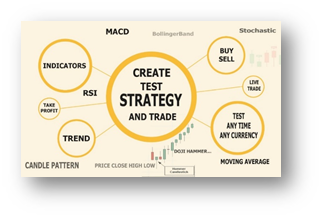
How to use the strategy maker tool
Step-by-step tutorial on working with Strategy Maker tool
To watch the video of this section, click the following link:
Version Meta Trader 4: https://www.mql5.com/en/market/product/65717
Version Meta Trader 5: https://www.mql5.com/en/market/product/66466
Basic settings:
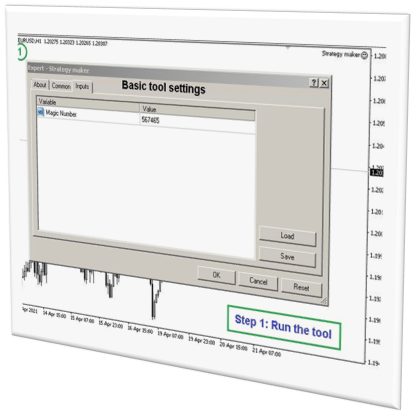
Run the tool and enter your desired settings:
Magic number settings are for those who want to use this tool as an expert.
Select the indicators and patterns required by your strategy:

On this page, you can select several indicators and templates and use them to build your strategy.
Non: In this section, you can select one of several ready-made indicators.
GetPrice:
If you enable these settings, you can use the following prices in the next section to build your strategy:
Open Price , Close Price , High Price , Low Price
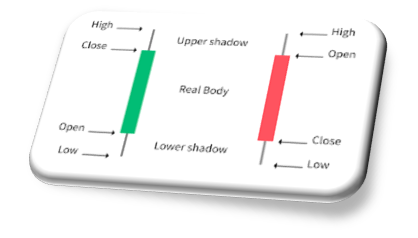
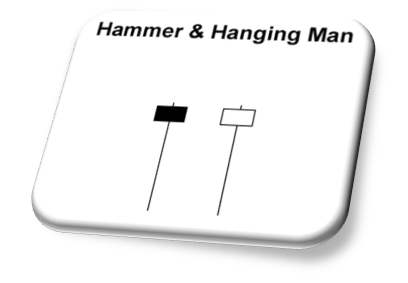
GetCandleShape:
If you enable these settings, you can use several candlestick patterns in the next section to build your strategy.
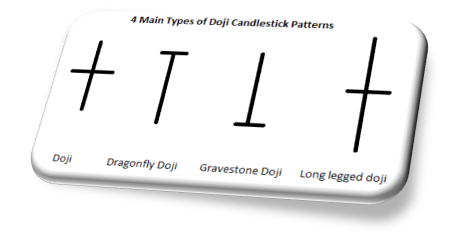
Some examples of ready-made patterns:
Doji , DojiDG , Hammer
Example:

For example, if you want to use the RSI indicator with period 14, you have to follow the figure.
In the next section, you can adjust your strategy using the indicators and patterns selected in the previous section.
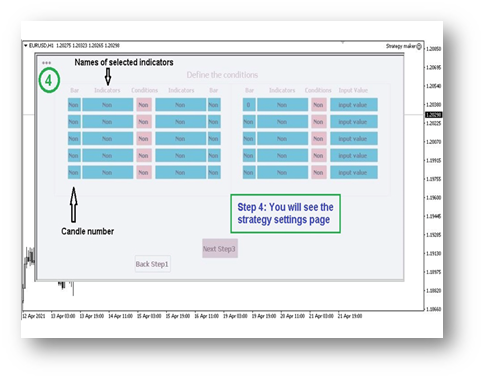
Indicators:
In this section, select the name of the indicator or pattern you want.
Click on Non and select one of the items.
Conditions
Select the bet you want.
For example, if you want the value of RSI to be equal to 70, select the == option.
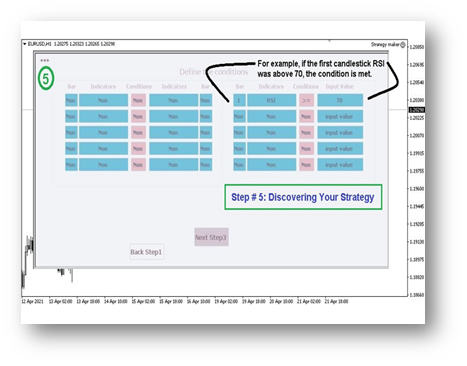
Bar:
Select the candlestick number.
For example, if you want the RSI value of the first candlestick to be equal to 70, you must select a value of 1.
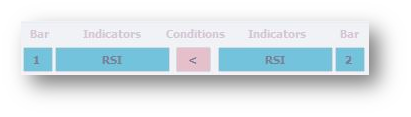
If you want the value of the second candle’s RSI to be greater than the value of the first Candle’s Rsi, you must select the number 1 on one side and the number 2 on the other.
Example:
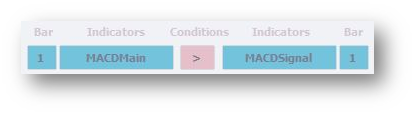
If you want the value of the MACD main line to be greatar than the MACD signal line, we use the following settings:
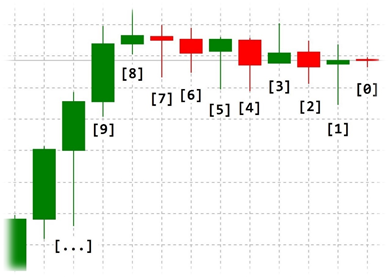
Instructions for using the Bar section:
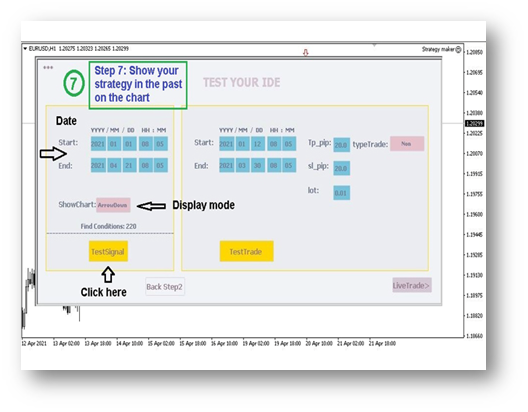
After building your strategy, now it's time to test it.
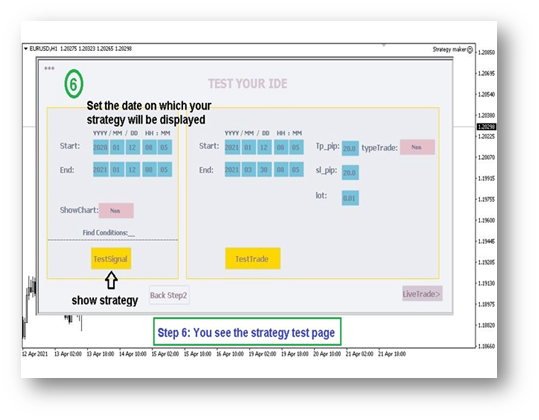
On the left, set the test time.
For example, set the last year.
ShowChart: Determine how the signal is displayed on the chart.
Available items: Arrow up , Arrow down , H-line , V-line , Number
Arrow up and down:

H-line and V-line:
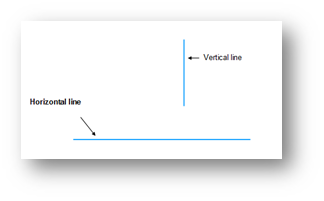
Example:
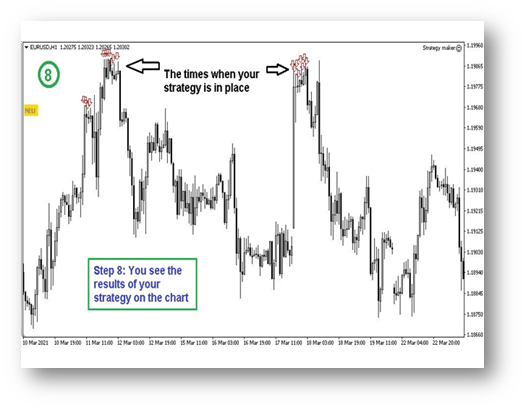
You can now see the items displayed in the chart:
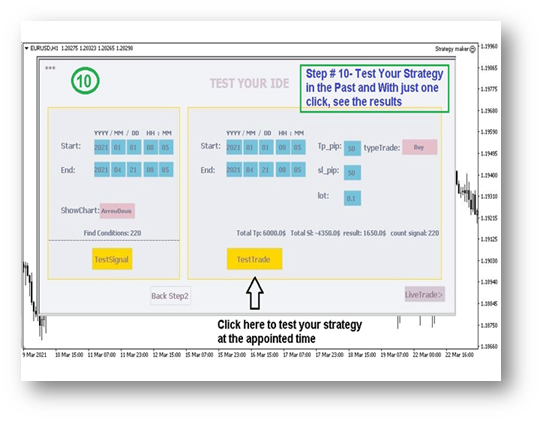
In the next part, you have to test your strategy with profit and loss limit.
You must specify 4 items:
Profit Limit (Pip), Loss Limit (Pip), Trading Volume (Lot), Type of Trading (Buy or Sell)
Also specify when to test your strategy.

Change the TP and SL to find the best settings for your strategy.
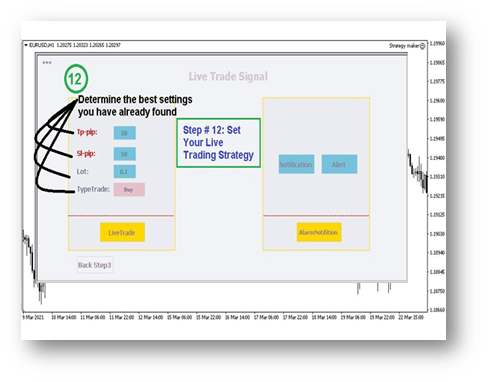
Now, it's time to implement the strategy in the live account.
If you are satisfied with your strategy, run it on a live account and leave everything to it as a fully automated expert.
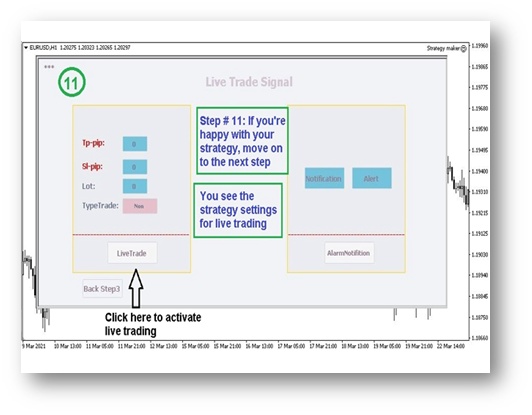
Settings in this section: Enter the best TP and SL you have found.
Specify the type of transaction and the amount of the transaction volume.
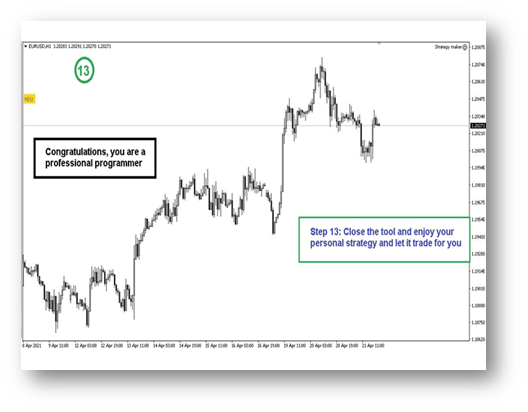
Congratulations.
You are a professional programmer.
Now let the expert trade for you.
Hide the tool. (Using the *** sign)
Enable trading permission settings and let Expert trade automatically.


")
 for the week of May 4 – May 8, 2026.")