

What Are Fibonacci Retracement Levels?
Fibonacci retracement levels are horizontal lines that indicate where support and resistance are likely to occur. They are based on Fibonacci numbers. Each level is associated with a percentage. The percentage is how much of a prior move the price has retraced. The Fibonacci retracement levels are 23.6%, 38.2%, 61.8%, and 78.6%. While not officially a Fibonacci ratio, 50% is also used.
The indicator is useful because it can be drawn between any two significant price points, such as a high and a low. The indicator will then create the levels between those two points.
Suppose the price of a stock rises $10 and then drops $2.36. In that case, it has retraced 23.6%, which is a Fibonacci number. Fibonacci numbers are found throughout nature. Therefore, many traders believe that these numbers also have relevance in financial markets.
How to Calculate Fibonacci Retracement Levels
As discussed above, there is nothing to calculate when it comes to Fibonacci retracement levels. They are simply percentages of whatever price range is chosen.
However, the origin of the Fibonacci numbers is fascinating. They are based on something called the Golden Ratio. Start a sequence of numbers with zero and one. Then, keep adding the prior two numbers to get a number string like this:
0, 1, 1, 2, 3, 5, 8, 13, 21, 34, 55, 89, 144, 233, 377, 610, 987... with the string continuing indefinitely.
The Fibonacci retracement levels are all derived from this number string. After the sequence gets going, dividing one number by the next number yields 0.618, or 61.8%. Divide a number by the second number to its right, and the result is 0.382 or 38.2%. All the ratios, except for 50% (since it is not an official Fibonacci number), are based on some mathematical calculation involving this number string.
Interestingly, the Golden Ratio of 0.618 or 1.618 is found in sunflowers, galaxy formations, shells, historical artifacts, and architecture.
For example:
89/144 = 0.618
144/233 = 0.618
377/610 = 0.618
At this stage, do bear in mind that 0.618, when expressed in percentage is 61.8%.
Similar consistency can be found when any number in the Fibonacci series is divided by a number two places higher.
For example:
13/34 = 0.382
21/55 = 0.382
34/89 = 0.382
0.382 when expressed in percentage terms is 38.2%
Also, there is consistency when a number in the Fibonacci series is divided by a number 3 place higher.
For example:
13/55 = 0.236
21/89 = 0.236
34/144 = 0.236
55/233 = 0.236
0.236 when expressed in percentage terms is 23.6%.
What Do Fibonacci Retracement Levels Tell You?
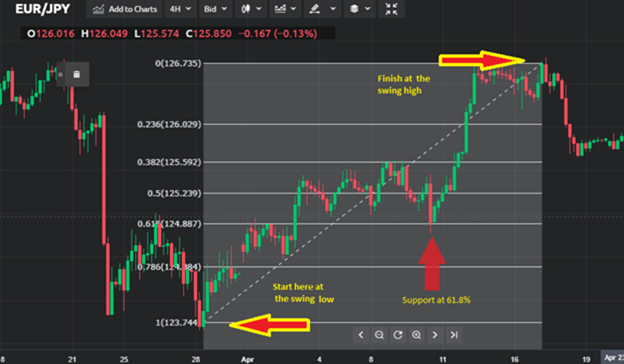
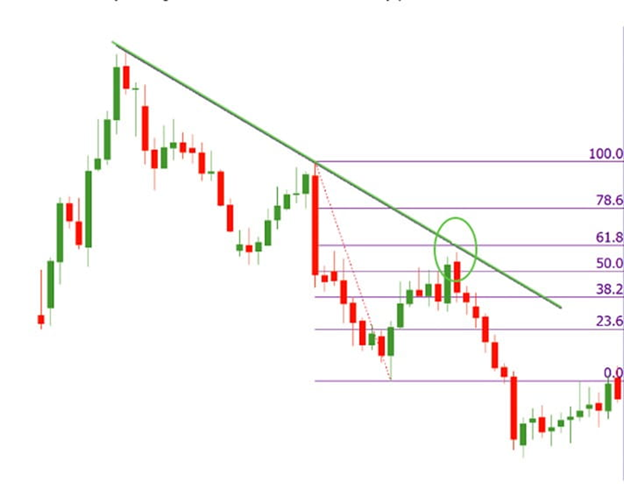
Fibonacci retracements can be used to place entry orders, determine stop-loss levels, or set price targets. For example, a trader may see a stock moving higher. After a move up, it retraces to the 61.8% level. Then, it starts to go up again. Since the bounce occurred at a Fibonacci level during an uptrend, the trader decides to buy. The trader might set a stop loss at the 61.8% level, as a return below that level could indicate that the rally has failed.
Fibonacci levels also arise in other ways within technical analysis. For example, they are prevalent in Gartley patterns and Elliott Wave theory. After a significant price movement up or down, these forms of technical analysis find that reversals tend to occur close to certain Fibonacci levels.
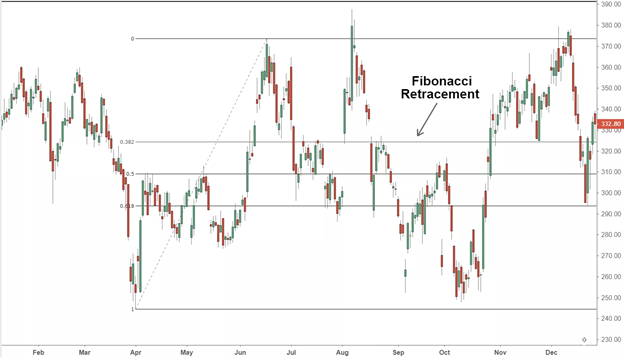
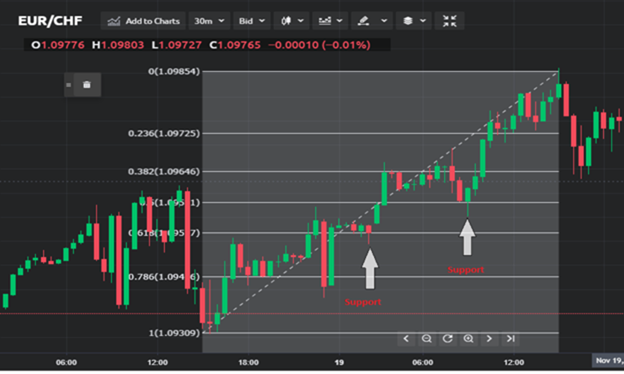
Fibonacci retracement levels are static prices that do not change, unlike moving averages. The static nature of the price levels allows for quick and easy identification. That helps traders and investors to anticipate and react prudently when the price levels are tested. These levels are inflection points where some type of price action is expected, either a reversal or a break.
Think of a situation where you wanted to buy a particular stock but you have not been able to do so because of a sharp run up in the stock. In such a situation the most prudent action to take would be to wait for a retracement in the stock. Fibonacci retracement levels such as 61.8%, 38.2%, and 23.6% act as a potential level upto which a stock can correct.
By plotting the Fibonacci retracement levels the trader can identify these retracement levels, and therefore position himself for an opportunity to enter the trade. However please note like any indicator, use the Fibonacci retracement as a confirmation tool.
I would buy a stock only after it has passed the other checklist items. In other words my conviction to buy would be higher if the stock has:
Formed a recognizable candlestick pattern
The stoploss coincides with the S&R level
Volumes are above average
Along with the above points, if the stoploss also coincides with the Fibonacci level then I know the trade setup is well aligned to all the variables and hence I would go in for a strong buy. The usage of the word ‘strong’ just indicates the level of conviction in the trade set up. The more confirming factors we use to study the trend and reversal, more robust is the signal. The same logic can also be applied for the short trade.
The Difference Between Fibonacci Retracements and Fibonacci Extensions
While Fibonacci retracements apply percentages to a pullback, Fibonacci extensions apply percentages to a move in the trending direction. For example, a stock goes from $5 to $10, and then back to $7.50. The move from $10 to $7.50 is a retracement. If the price starts rallying again and goes to $16, that is an extension.
Limitations of Using Fibonacci Retracement Levels
While the retracement levels indicate where the price might find support or resistance, there are no assurances the price will actually stop there. This is why other confirmation signals are often used, such as the price starting to bounce off the level.
The other argument against Fibonacci retracement levels is that there are so many of them that the price is likely to reverse near one of them quite often. The problem is that traders struggle to know which one will be useful at any particular time. When it doesn't work out, it can always be claimed that the trader should have been looking at another Fibonacci retracement level instead.
Subjective, There is a precise rule on how to draw the lines, but not all traders place the tool similarly. It’s hard to determine the point of the beginning of the baseline and the point of the end of the baseline. Some traders place it on the opened or closed prices of the candlestick or the lowest and the highest points of candlestick’s shadows.
Not fully accurate, Although Fibonacci levels work as support and resistance levels, the price often goes beyond them, which confuses traders. To avoid mistakes, you need to combine Fibo tools with other indicators.
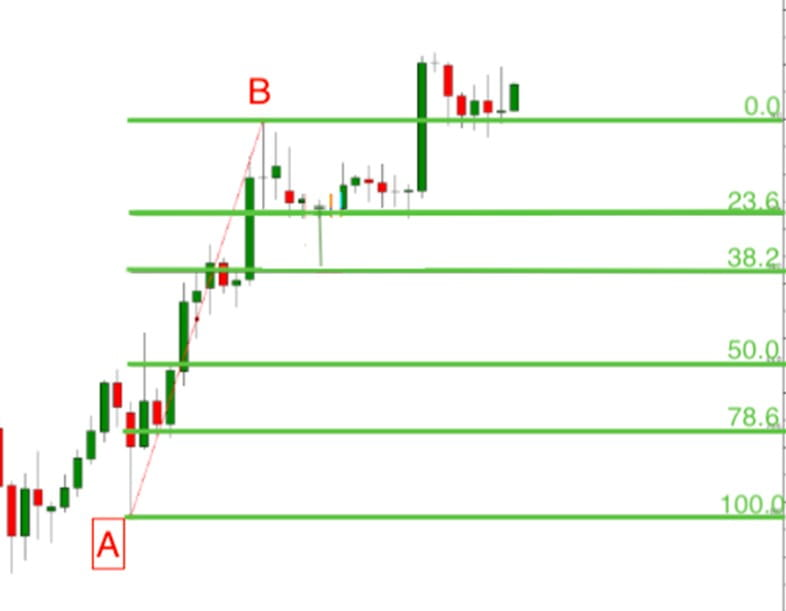
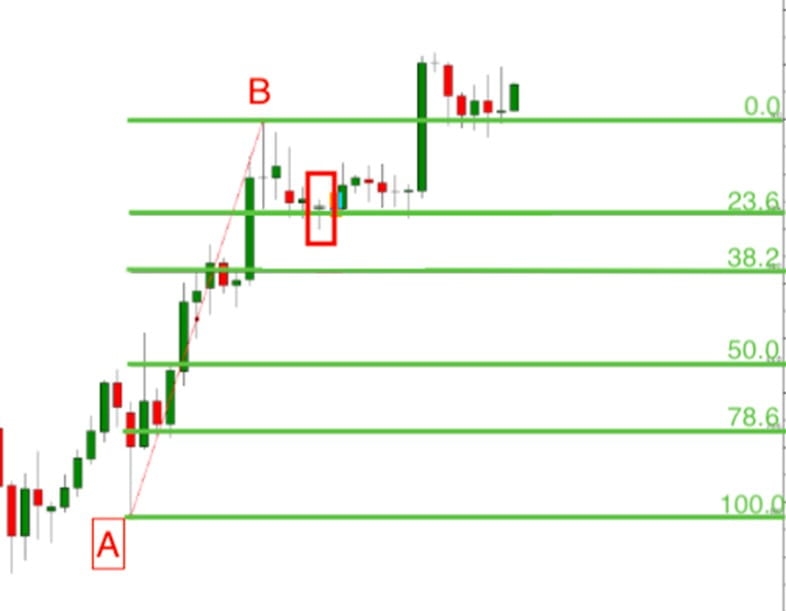
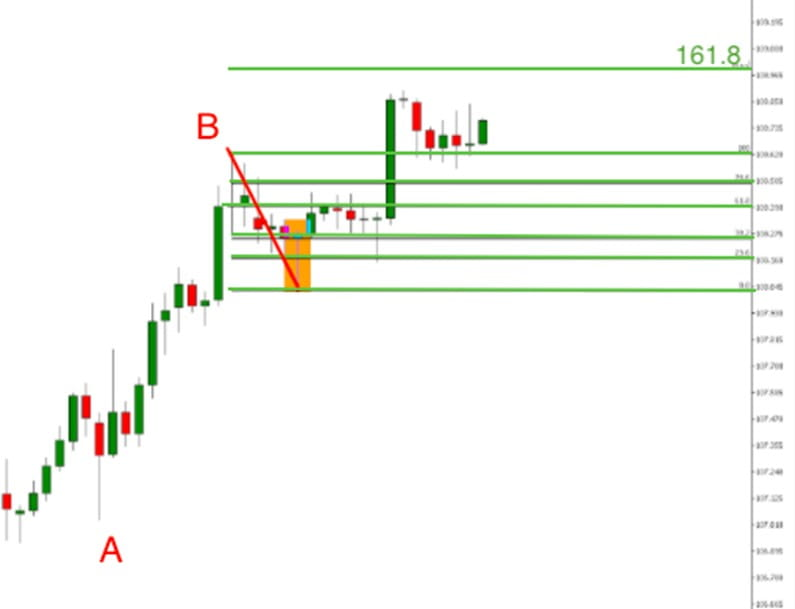
How to Use Fibonacci Retracement in Chart
Fibonacci retracement levels are used to predict the price correction against the primary trend.
How to Place
It’s essential to apply the indicator correctly to catch working trading signals.
- Find the Fibonacci retracement on your trading platform.
- Determine the current trend and find the highest and the lowest points. There must be no other tops and bottoms that exceed those you have chosen.
- Draw a line, so-called baseline, connecting the highest and the lowest points.
- If you trade in the bullish trend, draw the line from bottom to top. If you consider a bearish trend, the line should go from maximum to minimum. To make it easier, remember that you should draw the line from the left corner to the right corner.
- As soon as you draw the line, six horizontal Fibonacci levels will appear. These are 0.0%, 23.6%, 38.2%, 50%, 61.8%, 100%. You can always add additional levels if your trading strategy requires it.
- As these levels are used as support and resistance points, the price is supposed to consolidate near them. In such a situation, the price should either break the Fibo level, it will mean the trend is strong or move to the next level, signaling a continuation of the correction.
Consider some signals the levels may provide.
- If the price moves more than 61.8% of the preceding movement, there is a chance it will hit the level of the beginning of the trend.
- The 50% level is one of the most crucial levels. If there is an uptrend and the price breaks above it, it’s a signal to buy. If the price moves in the downtrend, it’s a sign of the short position.
- 50%, 61.8%, and 78.6% are the essential levels where the price shows the strongest reactions.
How to Trade Using Fibonacci Retracement
You can trade on Fibo retracement either in an aggressive or conservative way.
- Trade aggressively. In times of corrections, you can place new trades on each level of Fibo retracement against the prevailing trend.
- Trade conservative. If you believe the trend will resume, wait for the price to move in the direction of the trend after it rebounds from Fibonacci levels.
A crucial benefit of Fibonacci levels is that you can use them on different timeframes. Thus, you can apply this tool to several Fibonacci charts at once. If the levels converge, the signal is more prominent.
Fibonacci levels are considered as support and resistance points that should prevent further price movement, and usually, the price exceeds them. So, you need to wait for confirmation from other indicators.
Fibonacci tools don’t guarantee 100% success. That’s why you should combine them with other indicators and patterns.
Trend line. As the main aim of the Fibonacci retracement is to signal the most reliable support and resistance levels, you can confirm the signal by drawing a trend line. If the trend line and any of the levels coincide, this point may become the most forceful support or resistance level.
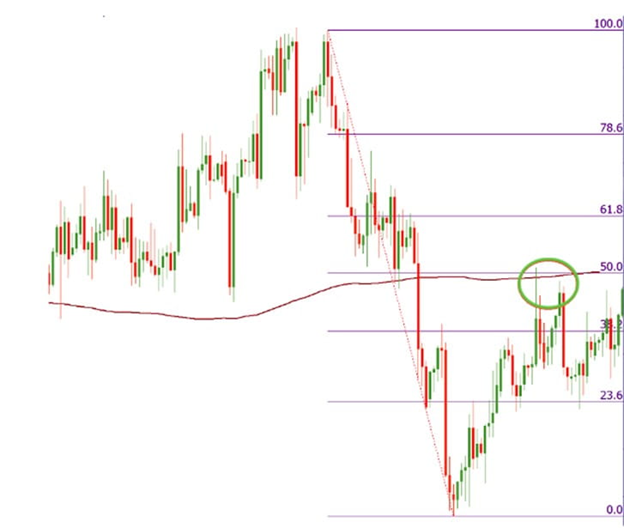
Moving Average. As we mentioned above, 50% is a substantial level that determines where the market will move in the future. Moving Averages are also a useful tool to find support and resistance levels. You can apply a 200-period Moving Average on the chart. Thus, if the 50% level interconnects with the 200-period MA, it’s a strong level to take profit and continue trading in the direction of the primary trend.
Candlestick patterns. If you need a confirmation of a reversal, you can use candlestick patterns. If you find any of the reversal patterns near the Fibo retracement level, it’s a signal the market may turn around.
What Is Fibonacci Expansion?
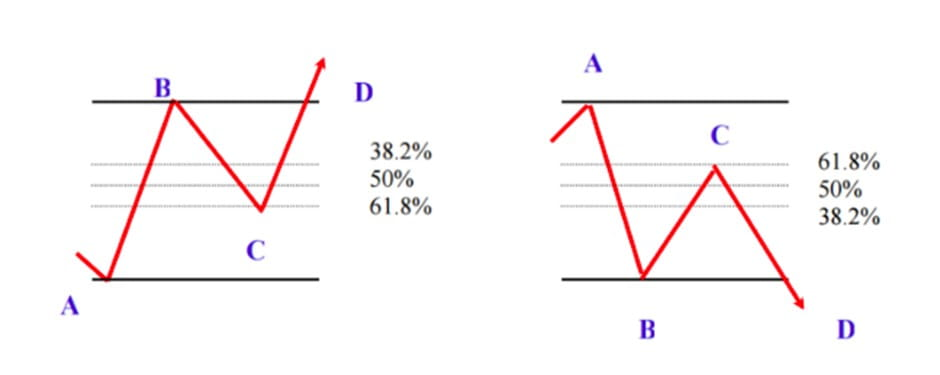
If you want to use Fibonacci expansions, you should know about two waves.
The first one is AB, that stands for the entire trend. The distance between A and B amounts to 100%.
The second wave is BC. It represents a correction of the primary trend. Point C is the start of the expansion. The expansion levels are 61.8% and 161.8%. There can also be two additional points 261.8% and 423.6%.
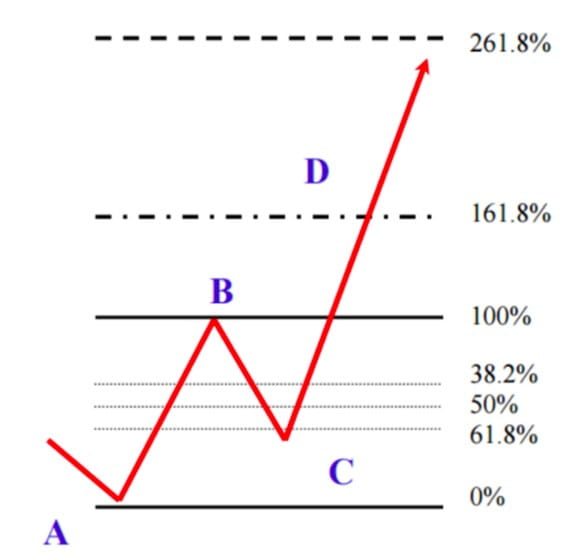
In general, three points are required to implement the tool. You need to determine the start of a new trend. After, you will need to find a higher low if you trade in the downtrend or a lower high in case of the uptrend.
Let’s consider an example. We have a price chart and we connect points A and B which determine the strength of the trend. After that, we need to select the Fibonacci tool again by clicking on the baseline. We draw the second line, dragging the line to the third top or bottom (C point). All three points should be connected.
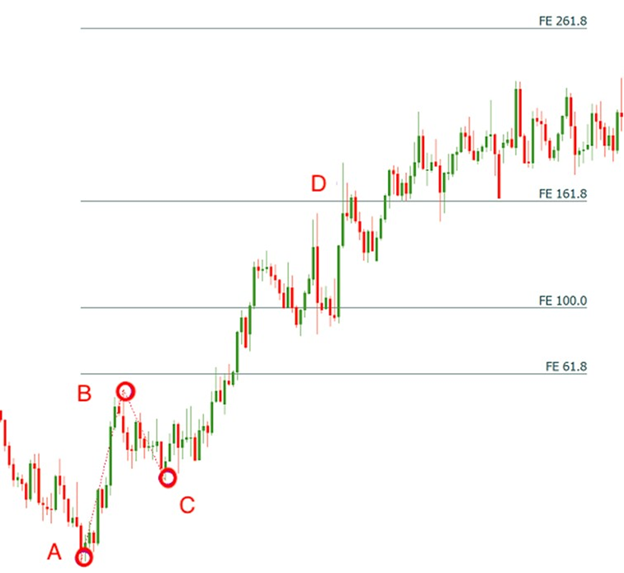
How to Trade Fibonacci Expansion
There are two points where you can open a position.
- The entry point may lie at one of the Fibonacci retracement levels (38.2%, 50%, or 61.8%). For instance, at point C.
- Or you can place the trade when the price is beyond point B (end of the first wave).
The Take Profit level will lie at 161.8%. If the third line is strong, the price may move to the next levels, for example, 261.8%.
Fibonacci Retracement Strategy
Previously, we mentioned how you can use Fibonacci tools to enter and exit positions, but there are other strategies you can apply to your trading.
Fibonacci and Candlesticks
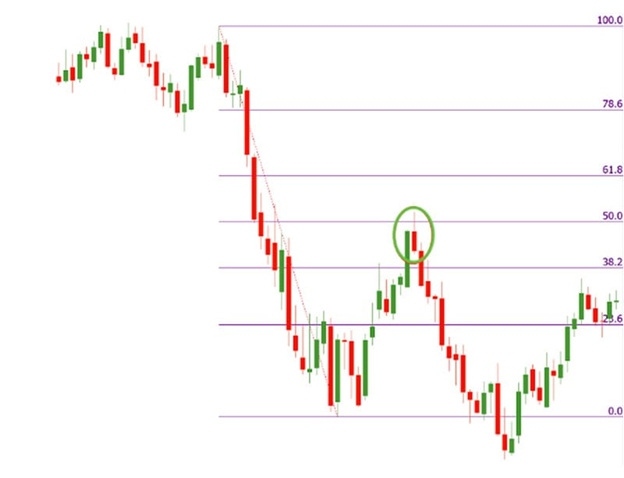
As we said above, it’s never enough to use Fibonacci tools alone. To get a confirmation, you can use candlesticks. As the main idea of the Fibonacci level is to determine price corrections, you should use reversal candlestick patterns that will confirm the correction.
The most famous patterns are the ‘hammer’ and ‘shooting star’. Hammer is a bullish pattern, that signals the end of the downtrend. The shooting star is a bearish pattern that determines the end of the uptrend.
Trade in the uptrend
Step 1. Find a strong uptrend. Draw Fibonacci levels from the lowest to the highest levels.
Step 2. Wait for the price chart to form the bullish reversal pattern, i.e. hammer. Enter the market with a long position.
Step 3. The price target should be placed at a 161.8% Fibonacci extension level. To find this level, you need to draw a line from point B (the highest point of the trend) to the low of the hammer candlestick.
Step 4. Place stop loss. The market can always move in the opposite direction. Thus, it’s crucial to place a stop loss level (1). The stop loss should be placed below the entry point.
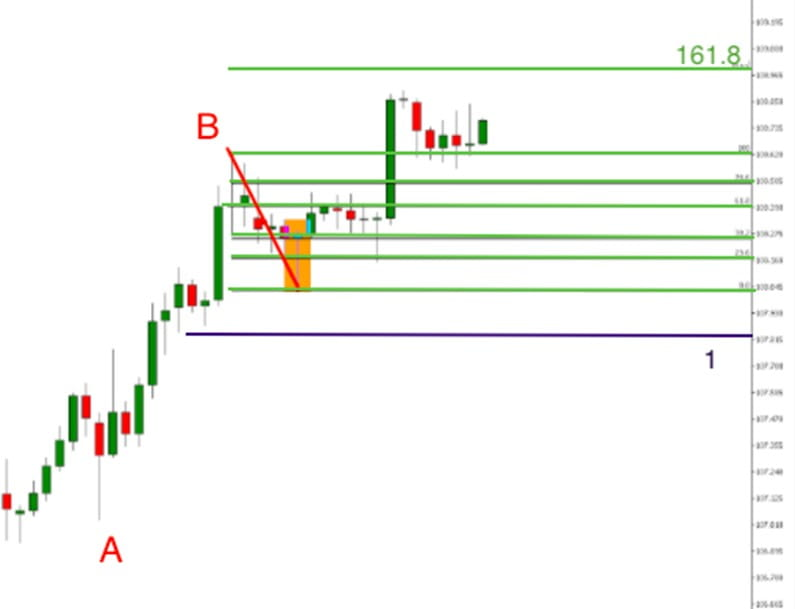
Trade in the uptrend. Step 4
Trade in the downtrend
You can apply the same strategy to the downtrend.
Step 1. Find a strong downtrend and draw the line from the highest level to the lowest level of the trend.
Step 2. Wait for a bullish candlestick pattern—for example, a shooting star. Place the sell position at this level.
Step 3. Place the take profit order at 161.8% Fibonacci extension level. To get the 161.8% level, you need to draw the second line from the lowest point to the level of the candlestick.
Step 4. Don’t forget about the stop-loss order. Place the level above the reversal candlestick.
KEY TAKEAWAYS
- Fibonacci retracement levels connect any two points that the trader views as relevant, typically a high point and a low point.
- The percentage levels provided are areas where the price could stall or reverse.
- The most commonly used ratios include 23.6%, 38.2%, 50%, 61.8%, and 78.6%.
- These levels should not be relied on exclusively, so it is dangerous to assume the price will reverse after hitting a specific Fibonacci level.
-
Fibonacci retracements and expansions are the most famous of the Fibo tools.
- Fibonacci levels are widely used in swing trading strategy. When Coming to Fibonacci retracement levels, the price starts consolidating.
- Fibonacci tools don’t guarantee 100% success. That’s why you should combine them with other indicators and patterns.
email: mohamedkabesh@yahoo.com
https://www.mql5.com/en/market/product/54894
https://www.mql5.com/en/market/product/53615
https://www.mql5.com/en/market/product/53467


 Trading Guide")
