


Description:
The idea of this EA is to allow the user to develop their own strategy , since few people understand programming.
The operation is quite simple. Initially EA comes with 5 indicators :
- 3 Moving Averages
- 1 Stochastic Oscillator
- 1 RSI
The user can configure the indicators however they want, even in different timeframes.
DETAIL OF PARAMETERS
Operations management setup:

- Max Slippage in Pips: Maximum deviation accepted for order opening.
- Max spread in Points: Maximum spread accepted for order opening.
- DebugMode: Displays on-screen account and market information.
- MagicNumberBuy : Magic Number for Buy Orders.
- MagicNumberSell: Magic Number for Sell Orders.
- Profit Method: Define if the profit will be obtained with a fixed TakeProfit or through TraillingStop .
- Take Profit: Take Profit in points.
- Stop Loss: Stop Loss in points.
- Trailling Stop Start Points: From how many points will start Trailling Stop.
- Order percent close on starting Trailling Stop: Enter how many x% will partially close the operation at the beginning of Trailling Stop. This aims to secure a portion of the order's profit before trying to catch a trend.
- Trailling Stop Step: Indicates how many points Trailling Stop will be moved by.
- Enable Break Even: Enables/Disables Break Even.
- Break Even Value: Value that will start Break Even.
- Order percent close on starting Break Even: Enter how many x% will partially close the operation at the beginning of Break Even. This is intended to secure a portion of the order's profit if the transaction comes back and closes on opening.
- Auto Lot: Enable/Disable Auto Lot .
- Lot Size Amplitude (if AutoLot is true): Automatic lot amplitude. The larger the larger the open lot size will be.
- First Lot (if AutoLot is false): Informs the size in the manual batch if Auto Lot is disabled.
- Mult Next Order if Last Order is Lost: If you want to multiply the lot size of the next operation if the previous one ends in loss.
- Order Mult: Multiplier.
Indicator Configuration:
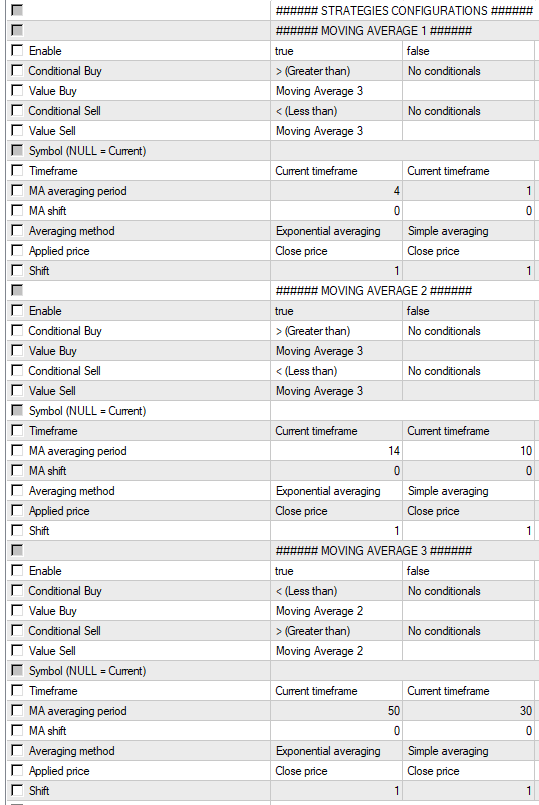
1. Moving Average

- Enable : Enables/Disables this moving average.
- Conditional Buy: Conditional for Buy.
- Value Buy : Value of the conditional. In this example it must be greater than Average 3 for a buy signal.
- Conditional Sell: Conditional Sell.
- Value Sell: Value of the Sell conditional. In this example it must be less than Average 3 for a sell signal.
- Symbol (NULL = Current): Asset where this moving average will be applied. Example: "EURUSD". Entering no value means whether the moving average will be applied to the current chart.
- Timeframe: Timeframe that moving average will be applied to.
- MA averaging period: Moving average period.
- MA shift: Moving average shift value.
- Averaging method: Moving Average Type.
- Applied price: Applied price.
- Shift : Offset in bars in the chart.
The parameters of the 3 averages are the same. What must be taken into account are the conditionals of the 3 so that you have a smart strategy. In the default settings the conditionals are:
- Buy: MA1> MA3, MA2 <MA1, MA3 <MA2
- Sell: MA1 <MA3, MA2> MA1, MA3> MA2
2. Stochastic Oscillator
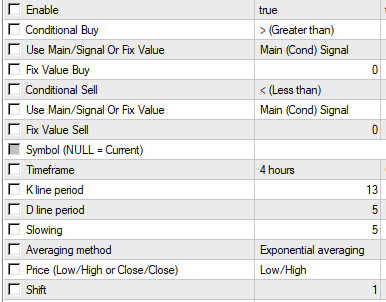
- Enable: Enables/Disables indicator.
- Conditional Buy: Conditional for Buy.
- Use Main/Signal Or Fix Value: Defines which type of conditionals will be used on the oscillator to Buy. Whether it will be a fixed value or if it will be larger or smaller than the signal line.
- Fix Value Buy: If a fixed value is used. Set the value here, for example > 20 to Buy.
- Conditional Sell: Conditional Sell.
- Use Main/Signal Or Fix Value: Defines which type of conditionals will be used on the oscillator for Sell. Whether it will be a fixed value or if it will be larger or smaller than the signal line.
- Fix Value Sell: If a fixed value is used. Set the value here, for example <80 for sell.
- Symbol (NULL = Current): Active where this stochastic will be applied. Example: "EURUSD". Entering no value means whether stochastic will be applied to the current chart.
- Timeframe: Timeframe in which the stochastic will be applied.
- K line period: % K Period.
- D line period: % D Period.
- Slowing: Slowing.
- Averaging method: Method (Simple averaging / Exponential averaging / Smoothed averaging / Linear-weighted averaging).
- Price (Low / High or Close / Close): Price Field (Low / High, Close / Close).
- Shift: Delay in chart.
2. Relative Strength Index (RSI)

- Enable: Enables/Disables the indicator.
- Conditional Buy: Conditional for Buy.
- Value Buy: Value of the conditional.
- Conditional Sell: Conditional Sell.
- Value Sell: Value of the conditional.
- Symbol (NULL = Current): Active where RSI will be applied. Example: "EURUSD". Entering no value means if RSI will be applied to the current chart.
- Timeframe: Timeframe in which the stochastic will be applied.
- Period: RSI Period. The default is 14.
- Applied price: Applied Price (Close price/Open price/Maximum price for period/Minimum price for period).
- Shift: Delay in chart.
Usage example:
As an example of usage, I took this moving average crossover strategy for the GBP/USD pair found at the following link: https://forextradingstrategies4u.com/4hr-gbpusd-forex-trading-strategy/
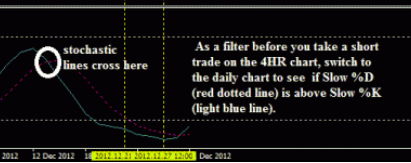
This strategy uses a moving average crossover in the 4H timeframe and the stochastic in the daily timeframe as follows:
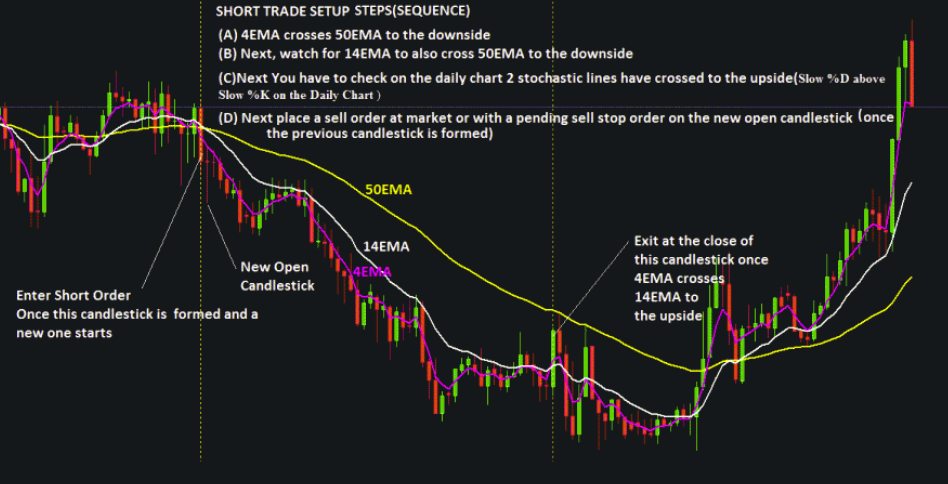
- Condition For Sell:
- When 4 EMA first crosses 50 EMA followed by14 EMA to the downside on the 4hr chart , then open a sell trade at market order.
- Place stop loss should be at 50 pips .
- You can set your take profit at 150 pips which is 3 times what you risked.
- Buy Condition :
- When 4 EMA first crosses 50 EMA followed by 14 EMA to the upside on the 4hr chart , then open to buy trade at market order.
- Place stop loss should be at 50 pips .
- You can set your take profit at 150 pips which is 3 times what you risked.
- Indicator Configuration:
- Slow stochastic indicator with these settings ( 13,5,5 ) applied to D1 chart .
- Exponential moving average 4 , EMA14 , and EMA 50 on the 4hr chart .
The configuration in EA looks like this:
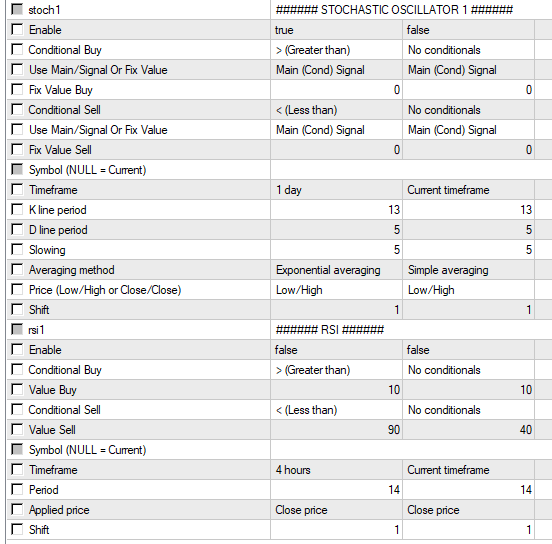
Note: RSI has been disabled as it will not be used in the strategy.
The order management configuration looks like this:

Remembering that the ideal is to perform optimization between Take Profit and Trailling Stop, to find out which one offers the best result, but I will follow the strategy chosen because I will talk about optimization in another opportunity.
Result:
The result particularly surprised me, this was the first strategy I found on the internet and testing in EA, and I had a great result, even without optimization:


We had a profit between 01/2018 - 12/2019 of about 30% , with a very low DD, close to 15%.


 Trading Guide")
