
AUDCAD 50pips and going- TRADING WITH WEIS WAVE WITH SPEED INDEX

Setup M30 Chart
Indicators: Weis Pip Wave, Weis Wave with Alert (+Speed Index) and No Demand No Supply ( https://www.mql5.com/en/users/takisd/seller)
First things first : WHERE ARE WE ON CHART?
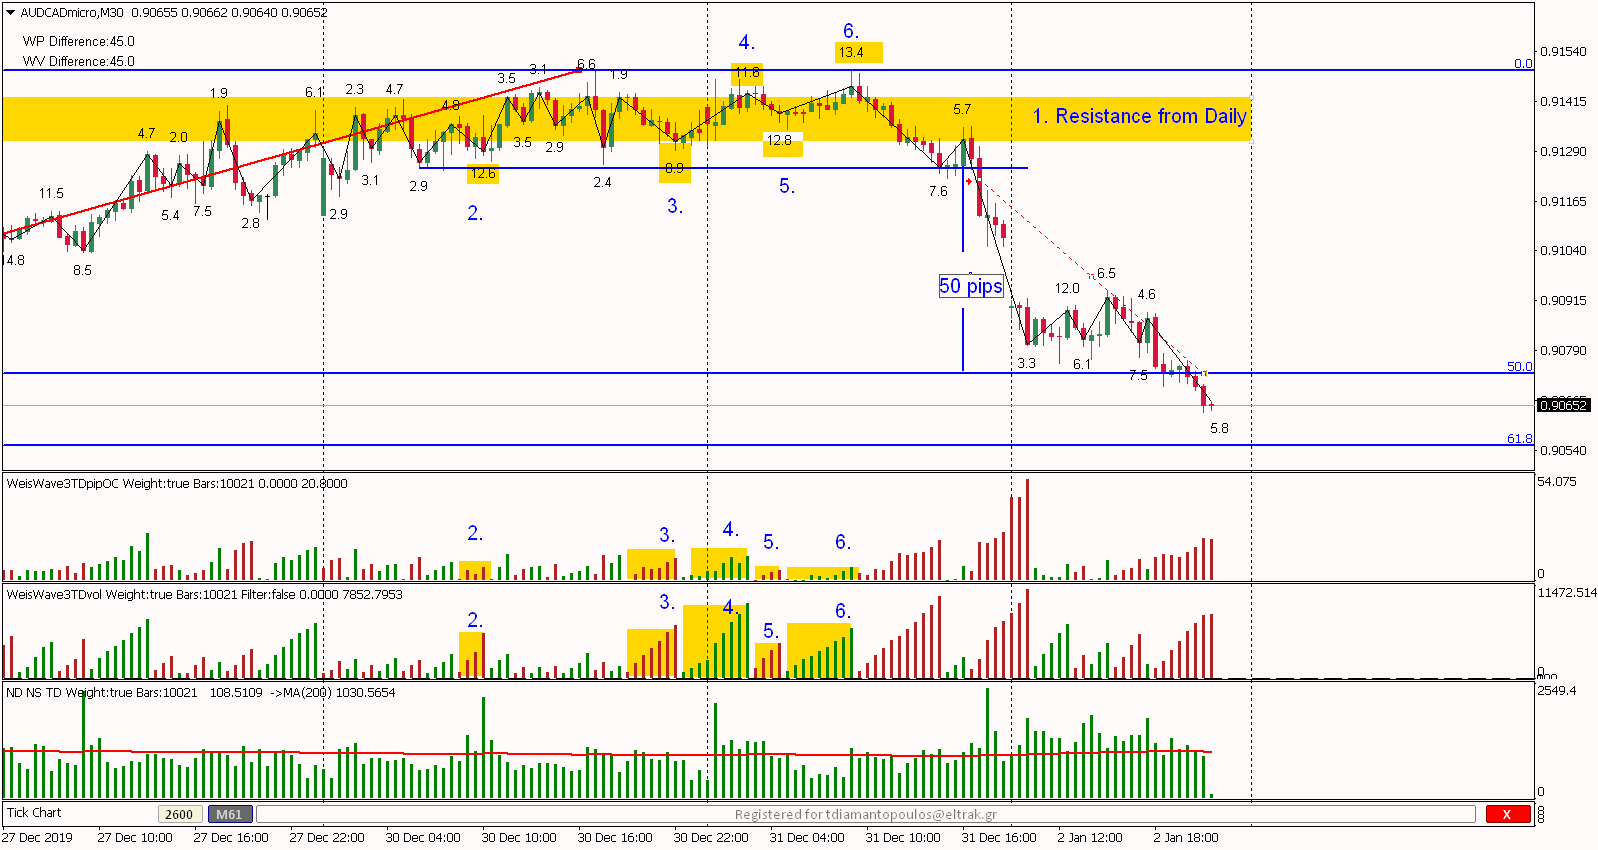
1. We are at Daily Resistance and at the same time this a an area of 50-61.8 Fib on a weekly chart.
2. First Push Down - High Down Volume - Small Pip Move and a High SI of 12.6
3. Second Push Down - High Down Volume - Small Pip Move and a SI of 8.9
4. Hard Time to move up - High Up Volume - Small Pip Move and a High SI of 11.6
5. Third Push Down - High Down Volume - Small Pip Move and a High SI of 12.8
6. Hard Time to move up - High Up Volume - Small Pip Move and a High SI of 13.4
So what is clue in this wave sequence ? The answer is the last two (comment 5. and 6.) and Down WE GO 50 pips ( order visible on Chart)
Watch out now !!! retracement expected we are at 50-61.8 Fib Area.


 & AMD Framework")
