

Introduction.
Most of the indicators currently used by traders in the Forex market were created for another market - the stock market and for another time, when there were quite monotonous trends and quotes were not so volatile as at present, when there are no trends as steady trends of unidirectional price movement. For a technical assessment of the state of the Forex market and its instruments, first of all, a statistical analysis of the history of their quotes is necessary, which makes it possible to identify patterns important for trading.
The StatPredict indicator is based on a number of statistical, established by the author, patterns of the market, as well as a purely mathematical, based on these patterns, constructions, which does not attract any hypothetical market models. In other words, the author does not try to clamp non-stationary random market processes in the cliché of some contrived models, but uses only logic and statistics that works in all situations.
The indicator predicts the price in accordance with the prevailing trend and its own small statistical price fluctuations around this trend. At the same time, in StatPredict, you need to set the time horizon of the forecasted events, which is set by the parameter settings of the “Length of forecast in bars” indicator and determined by the characteristic time scale of the current trend, which is best measured by the ProfitMACDindicator or by the previous price consolidation period, from which as a forecast horizon, you can take one-fourth.
The final calculation of the indicator readings after installing it on the chart occurs when a new tick arrives.
Information about the operation mode of the indicator is printed when it is installed on a chart in the “expert” tab.
1. Purpose of the indicator
Using mathematical methods for predicting random processes, StatPredictindicator predicts the most probable values of the future price and calculates the confidence interval for them.
The StatPredict indicator works on all time scales and is suitable for both long-term play and scalpers.
In addition to the position of the most likely forecast points (indicated by arrows oriented by the calculated price movement at the corresponding future bar), considered for the median price (high + low) / 2, StatPredict calculates the limits of the confidence interval for the predictions that are indicated by triangles and are considered at the top of the confidence channel for maximum price, and at the bottom of the channel for the minimum price. The value of the confidence probability used in the algorithm is specified in the indicator settings.
Additionally, the indicator also draws an unbiased average curve, which allows for a better determination of the scale of trend movements.
2. The use of the indicator in the trade.
The StatPredict indicator predicts the future emerging from the already established trend trends and steady own “statistical fluctuations” of prices. The prediction algorithm cannot deliberately take into account the strong effects on the price caused by large events that have not yet occurred, such as important news, etc. Therefore, it is incorrect to use StatPredictfor the forecast before the release of important news and immediately after their release (it is advisable to wait for the volatility to decrease). It is also incorrect, using the indicator on small timeframes, to capture with its horizon of forecasting the future moments of the release of important news.
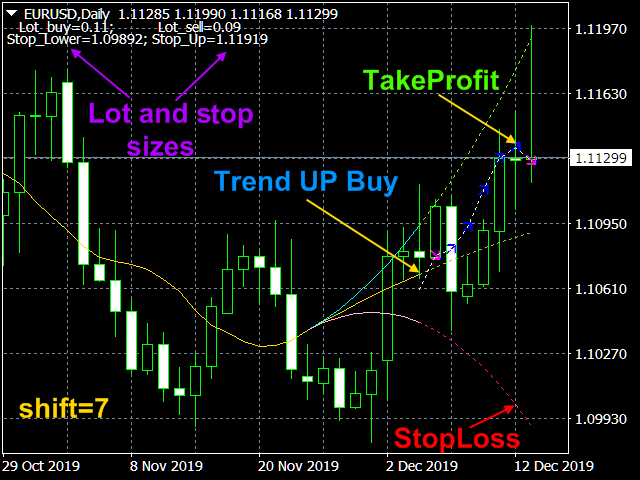
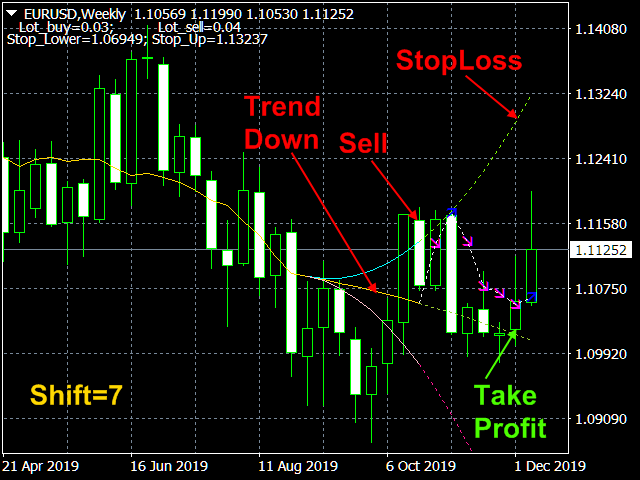
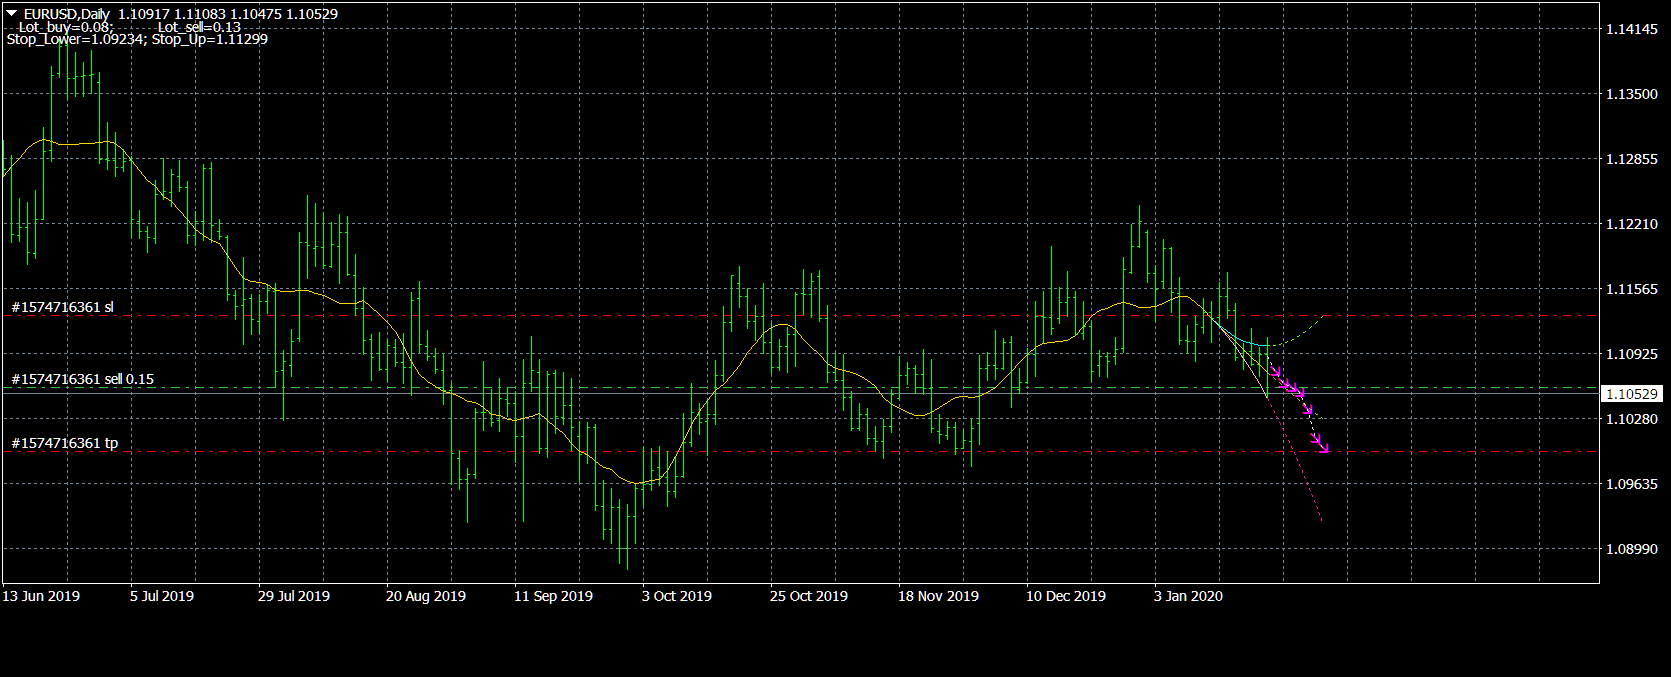
The use of the indicator is very simple. The indicator with arrows draws the trajectory of the future price movement, on which TakeProfit of the opened positions are placed, and StopLoss are placed on the boundaries of the confidence level channel. With an increase in the forecast price, positions are opened on Buy, and when they fall on Sell.
StatPredictalso provides the option to calculate the lot, based on the positions of the last points of the calculated channel of confidence probability, as well as the size of the deposit and the allowable risk, which are specified in the indicator settings. Lot sizes are printed in the comments (on the MT screen) along with the positions of the corresponding StopLoss.
3. Indicator settings.
- Length of forecast in bars - The number of bars that are forecasted. Values: any positive integer (7 default).
- Confidence probability - Values: any real number from 0 to 0.999 (0.67 default).
- Global indicator shift (to estimate the forecast) - Shift indicator to adjust its operation. Values: any positive integer (0 default).
- Dimensions of markers - Marker sizes to display forecast points. Values: any positive integer from 0 to 5 (3 default).
- Calculate the lot size from the risk, deposit and CP*? – Calculate the size of the lot, based on the risk, the size of deposit and channel size of confidence probability level? Values: true, false (default).
- Deposit in $ - Deposit amount in dollars (5000 $ default).
- Allowable losses in % - Permissible loss as the percentage of the deposit (2% default).
Screenshots.
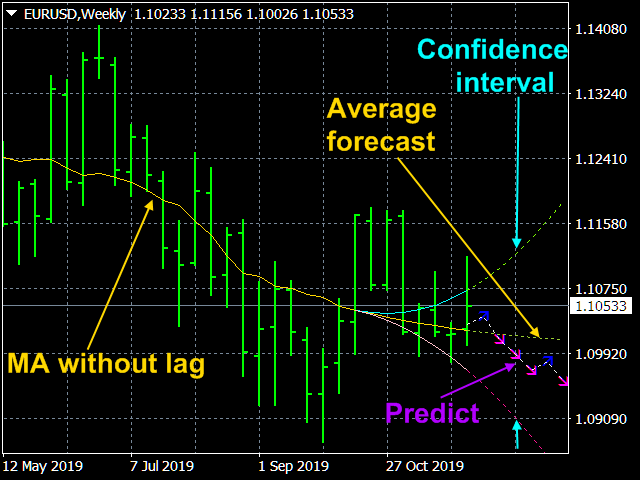

StatPredict, Iterative Moving Average and Profit MACD indicators
Click on the graph to see the process in dynamics.
Click on the graph to see the process in dynamics.


")
![[XAUUSD]: Weekly Liquidity Activation Points (timings), June 22-26, 2026](https://c.mql5.com/6/1013/splash-preview-771790.png "[XAUUSD]: Weekly Liquidity Activation Points (timings), June 22-26, 2026")
")