

Against the background of the continuing instability of stock markets, as well as weaker than expected macro data coming from the US, and the weakening dollar, investors are buying gold again. Last Monday, gold prices peaked from the end of July.
Gold futures on COMEX rose on Monday to $ 1233.00 per ounce.
A weaker dollar makes gold more attractive to holders of other currencies.
However, the current growth in gold prices should be considered as a correction after a long period of decline.
American stock indices in general are holding near record levels this year, and a strong dollar and high yield of treasury bonds have a negative impact on gold. After new strong financial reports and economic data, stock indexes and the dollar will start to grow again, and this will limit the potential for gold price growth.
Despite the recent increase in gold quotes, it is necessary to look for an opportunity to enter short positions in the XAU / USD pair.
The general trend of XAU / USD is still bearish. In the face of rising interest rates, the investment attractiveness of the dollar is rising, and of gold - is falling.
*)An advanced fundamental analysis is available on the Tifia Forex Broker website at tifia.com/analytics
Support and Resistance Levels
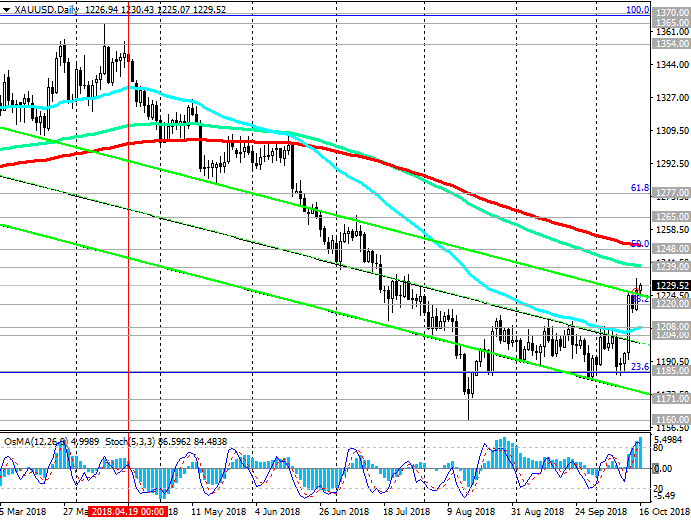
From mid-April, XAU / USD has been trading in a downward channel on a weekly chart, the lower limit of which is near the support level of 1050.00 (2015 lows).
Below the key resistance level of 1248.00 (EMA200 on the daily chart and the Fibonacci level of 50% of the correction to the wave of decline since July 2016), the downward trend prevails.
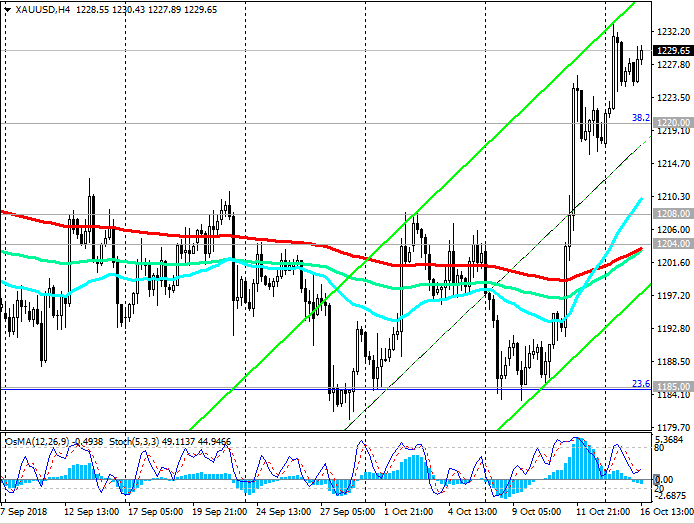
The breakdown of the support level of 1220.00 (Fibonacci level 38.2%) confirms the return of XAU / USD to the global downtrend, which began in October 2012, and into the downward channel on the daily chart.
Correctional growth may still continue to resistance levels of 1239.00 (EMA144 on the daily chart), 1248.00.
However, in the long run, short positions are preferred below these levels.
Levels of support: 1220.00, 1208.00, 1204.00, 1185.00, 1171.00, 1160.00, 1128.00, 1085.00, 1050.00
Resistance Levels: 1239.00, 1248.00, 1265.00, 1277.00
Trading Scenarios
Sell Stop 1224.00. Stop Loss 1234.00. Take-Profit 1220.00, 1208.00, 1204.00, 1185.00, 1171.00, 1160.00, 1128.00, 1085.00, 1050.00
Buy Stop 1234.00. Stop Loss 1224.00. Take-Profit 1239.00, 1248.00, 1265.00, 1277.00
*) For up-to-date and detailed analytics and news on the forex market visit Tifia Forex Broker website tifia.com


 Trading Guide")
