

Leading US indices since last week are under pressure against the backdrop of rising government bond yields to multi-year marks.
On Tuesday, the yield on 10-year US Treasury bonds reached 3.261%, the highest in 7.5 years.
The growth of profitability is worrying investors. Many of them believe that the US stock market still has room for growth due to good economic data and high levels of business and consumer confidence. However, against the background of further increases in interest rates, there will be more and more doubts about the prospects for further growth of the market.
Increasing bond yields reduce the attractiveness of riskier assets, including stocks, and may trigger a slowdown in economic growth.
Investors are also analyzing the development of the trade conflict between the United States and China.
If the White House will levy duties on all of China’s imports to the United States, markets and the economy will take it negatively.
Before the resolution of the trade conflict between these two largest economies in the world is still far away, investors are eager to understand how the customs duties they have introduced will affect the global economy.
European and Asian indices are also declining after the US. European Stoxx Europe 600 fell by 0.4%, the shares of automotive and chemical companies dropped the hardest.
The Japanese Nikkei Stock Average Index declined by 1.3%. Hong Kong's Hang Seng Index decreased 0.1%.
After the Dow Jones Industrial Average rose at the beginning of the month to a new record high of 26953.0, DJIA futures fell from the opening of the trading day on Tuesday, reaching 26390.0 by the beginning of the American session.
*)An advanced fundamental analysis is available on the Tifia Forex Broker website at tifia.com/analytics
Support and Resistance Levels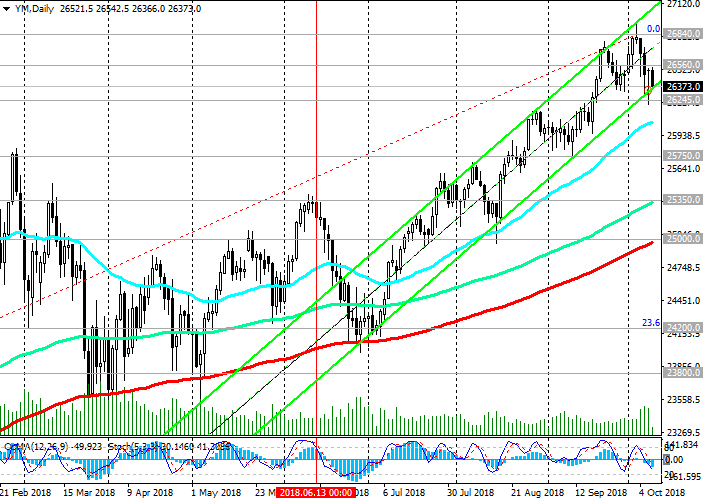
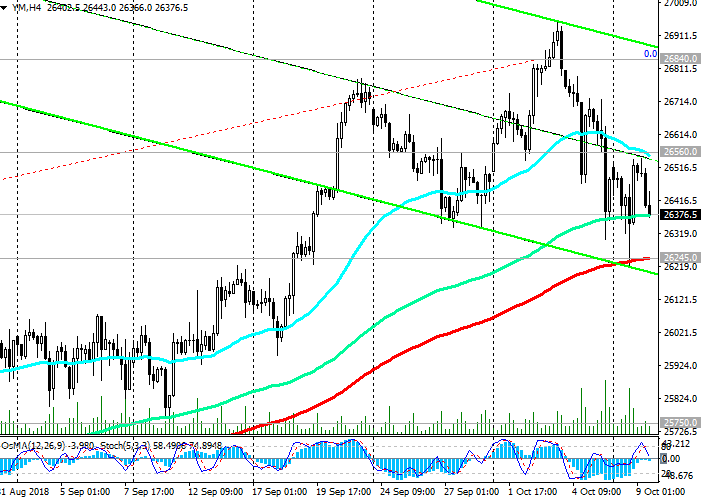
The DJIA so far maintains a long-term positive trend, trading in the ascending channels on the daily and weekly charts. Only the long positions should be considered above the support level of 26245.0 (ЕМА200 on the 4-hour chart).
Breakdown of this support level may provoke a deeper correctional decrease to key support levels of 25350.0 (ЕМА144 on the daily chart), 25000.0 (ЕМА200 on the daily chart). The bottom line of the ascending channel on the weekly chart also passes near these levels.
In general, positive dynamics remain, and long positions are preferable. Only a breakdown of the support level of 24200.0 (Fibonacci level 23.6% of the correction to growth from 15650.0 in the wave that began in January 2016. The maximum of this wave and the Fibonacci level 0% are close to 26620.0) can again threaten the bull trend.
Support Levels: 26245.0, 26000.0, 25750.0, 25350.0, 25000.0, 24930.0, 24200.0
Resistance Levels: 26560.0, 26840.0, 27000.0, 28000.0, 29000.0
Trading Scenarios
Buy Stop 26580.0. Stop Loss 26200.0. Take-Profit 26840.0, 27000.0, 28000.0, 29000.0
Sell Stop 26200.0. Stop Loss 26580.0. Take-Profit 26000.0, 25750.0, 25350.0, 25000.0
*) For up-to-date and detailed analytics and news on the forex market visit Tifia Forex Broker website tifia.com


 Trading Guide")
