
NZD/USD: Trading Scenarios on the eve of the RBNZ meeting

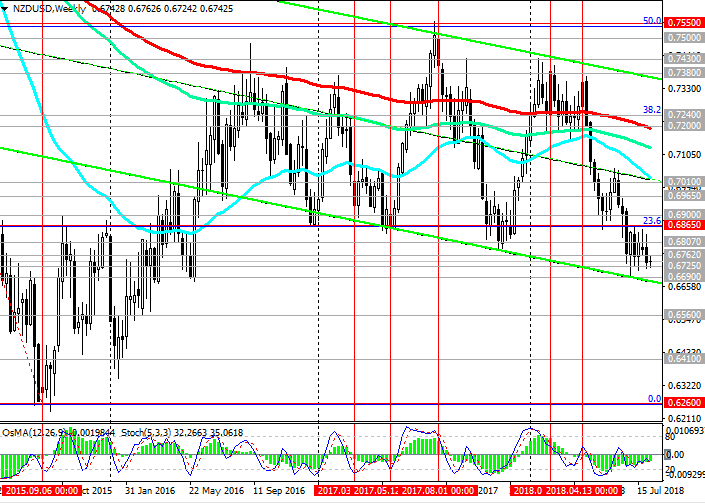
Since mid-April, the NZD / USD has been trading in a downward channel, falling from the level of 0.7380. After the breakdown of the important support levels of 0.7240 (the Fibonacci level 38.2% of the upward correction to the global wave of decline of the pair from the level of 0.8800, which began in July 2014; the wave minimums are near the level of 0.6260), 0.7200 (EMA200 on the weekly chart) the NZD / USD decline accelerated. In July, NZD / USD reached multi-month lows near the 0.6690 mark. However, later, NZD / USD "fell into a drift", having spent July in the range between the levels of 0.6725, 0.6865 (Fibonacci level of 23.6%).
The negative trend persists, and NZD / USD is traded in the descending channel on the daily chart.
In case of breakdown of support levels of 0.6725, 0.6690 NZD / USD will target at May 2016 lows near the 0.6675 mark.
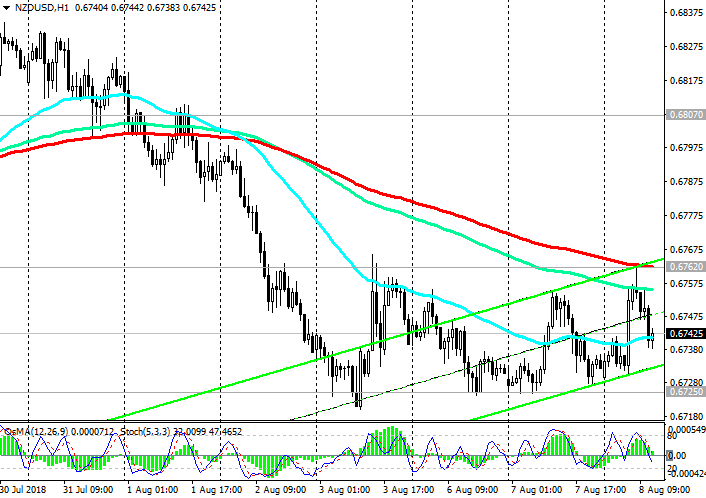
A signal for the development of an upward correction may be a breakdown of the short-term resistance level 0.6762 (EMA200 on a 1-hour chart). The correction target may be the level of resistance 0.6865 (Fibonacci level of 23.6% and the upper limit of the range formed in July). The strong negative dynamics prevails.
Indicators OsMA and Stochastics on the daily, weekly, monthly charts are on the side of sellers.
Below the resistance level 0.6865 short positions are preferred. The global downtrend, which began in July 2014, resumed.
Today at 22:00 (GMT) the decision of the RBNZ on the interest rate will be published. Probably, the interest rate will remain at the same level of 1.75%. If, during a press conference that starts at 11:00 pm (GMT), signals about the possibility of tightening monetary policy in the near future will sound, then the New Zealand dollar may strengthen, including against the US dollar. Nevertheless, the growth of NZD against the USD will be short-term.
*)An advanced fundamental analysis is available on the Tifia Forex Broker website at tifia.com/analytics
Support levels: 0.6725, 0.6700, 0.6690,
0.6675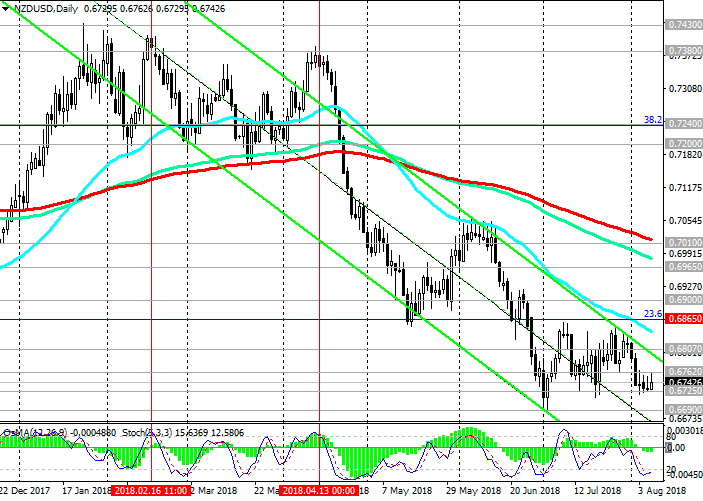
Resistance levels: 0.6762, 0.6807, 0.6865, 0.6900, 0.6965, 0.7010
Trading Scenarios
Sell Stop 0.6720. Stop-Loss 0.6765. Take-Profit 0.6700, 0.6690, 0.6675, 0.6600
Buy Stop 0.6765. Stop-Loss 0.6720. Take-Profit 0.6805, 0.6865, 0.6900, 0.6965, 0.7010
*) For up-to-date and detailed analytics and
news on the forex market visit Tifia Forex Broker website tifia.com


 Trading Guide")
