

From the middle of April and from the level of 1.4340, the GBP / USD fell sharply. The decrease to current levels was almost 10%. Starting in May, GBP / USD is traded in a downward channel on the daily chart, the lower limit of which is near the support level of 1.2900.
Below the nearest resistance levels 1.3213 (the Fibonacci level of 23.6% of the correction to the GBP / USD decline in the wave, which began in July 2014 near the level of 1.7200), 1.3248 (EMA50 and the upper limit of the descending channel on the daily chart), only short positions should be considered.
The negative dynamics is maintained, and if the decline continues, the 1.2900 mark will be the immediate target.
The further target of the decline is the level of 1.2590 (June 2017 lows).
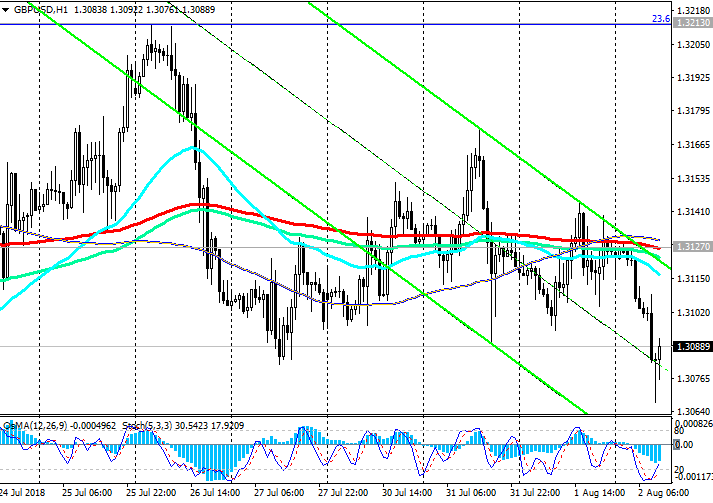
The signal for corrective growth will be a confirmed short-term resistance level of 1.3127 (EMA200 on the 1-hour chart) breakdown. In this case, the corrective growth can continue to the resistance levels 1.3213, 1.3248.
Short positions are preferred, long-term bearish trend is maintained.
*)An advanced fundamental analysis is available on the Tifia Forex Broker website at tifia.com/analytics
Support levels: 1.3055, 1.3000, 1.2960,
1.2900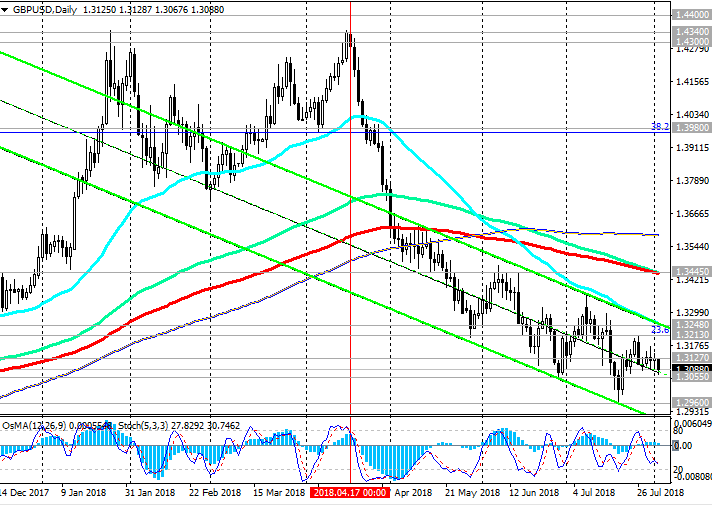
Resistance levels: 1.3127, 1.3213, 1.3248, 1.3335, 1.3445
Trading Scenarios
Sell in the market. Stop-Loss 1.3140. Take-Profit 1.3055, 1.3000, 1.2960, 1.2900
Buy Stop 1.3140. Stop-Loss 1.3090. Take-Profit 1.3213, 1.3248, 1.3335, 1.3445
*) For up-to-date and detailed analytics and news on the forex market visit Tifia Forex Broker website tifia.com


 Trading Guide")
