

The Ivanov Bands (IB) indicator is a generalization of the Bollinger Bands indicator, where not the standard deviations of std are laid on both sides of the moving average MA, but rather average deviations calculated by various implementations of a more general algorithm based on Kolmogorov averaging, which for the set ![]() of numbers has the form:
of numbers has the form:
 ,
,
where ![]() - is a continuous monotonic function, and
- is a continuous monotonic function, and ![]() - is its inverse. Accordingly, for deviations from the mean
- is its inverse. Accordingly, for deviations from the mean ![]() , one must use expression
, one must use expression
 .
.
IB allows you to plot an infinite number of different channels similar to Bollinger Bands, but different from it, including Bollinger Bands only as a special case. IB is essentially an experimental stand form plotting and studying different channels in order to find the most suitable one for the manual or automatic strategy used by trader.
When plotting IB channels, you can either (1) level out the sharp price spikes (that is, the robust method), obtaining smooth lines (with weak response to spikes) for more reliable channels, or, conversely, (2) make the channels very sensitive to such spikes, which allows using sharp breaks of their lines as very reliable sources of additional information on changes in the price movement direction.
The IB indicator uses six different particular implementations of the general algorithm for calculating the average deviation from MA, while only the first of them - (1) mean power deviation leads to construction of the Bollinger Bands lines in the case of exponent n=2. For convenience, this appears in the default settings. In addition, IB also employs algorithms for calculating the following averages: (2) logarithmic, (3) exponential, (4) exponential root mean square, (5) sinusoidal and (6) angular deviations. Each of them (except for logarithmic) can be configured to robust and inverse modes.
The formulas of mean deviations used for plotting the IB channels are as follows:

Fig. 1. Mean deviation formulas.
Setting up the indicator
- Price type - applied price. Values: Close price (default), Open price, High price, Low price, Median price ((high + low)/2), Typical price ((high + low + close)/3), Weighted price ((high + low + 2*close)/4).
- The averaging method - averaging method. Values: Simple (default), Exponential, Smoothed, Linear weighted.
- Choose simulation Bands mode – select the algorithm for calculating the mean deviations. Values:
- 1. (<(|x - <x>|)^n>)^(1/n) - mean power (default)
- 2. exp(<ln(|x - <x>|)>) - mean log
- 3. n*std*ln(<exp(|x - <x>|/(n*std))>) - average exponential
- 4. n*std*sqrt(ln(<exp(sign(n)*((x - <x>)/(n*std*))^2)>)) – exponential root mean square
- 5. n*std*arcsin(<sin(pi*|x - <x>|/|n*std|/2)>)/(pi/2) - average sinusoidal
- 6. n*std*sin(<arcsin(|x - <x>|/|n*std|)>) - angular mean
- The averaging period - averaging period. Any integer (20 by default).
- Channel width factor 'K' - channel width factor. Values: any real number.
- Exponent 'n' - exponent for (1) the exponential averaging algorithm. Scale multiplier for other averaging types (3-6). Values: any real number except 0.
Screenshots
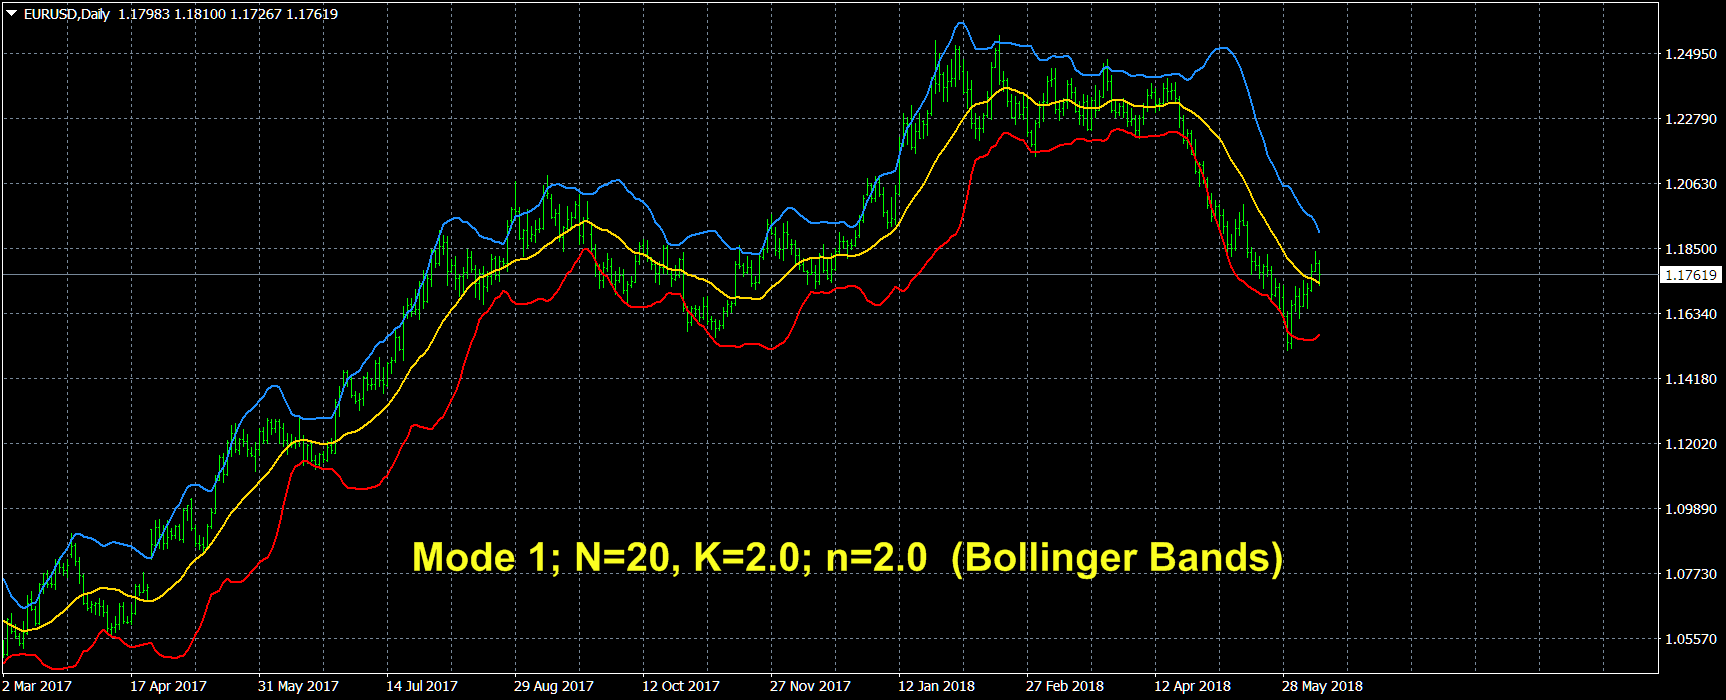
Fig. 2.
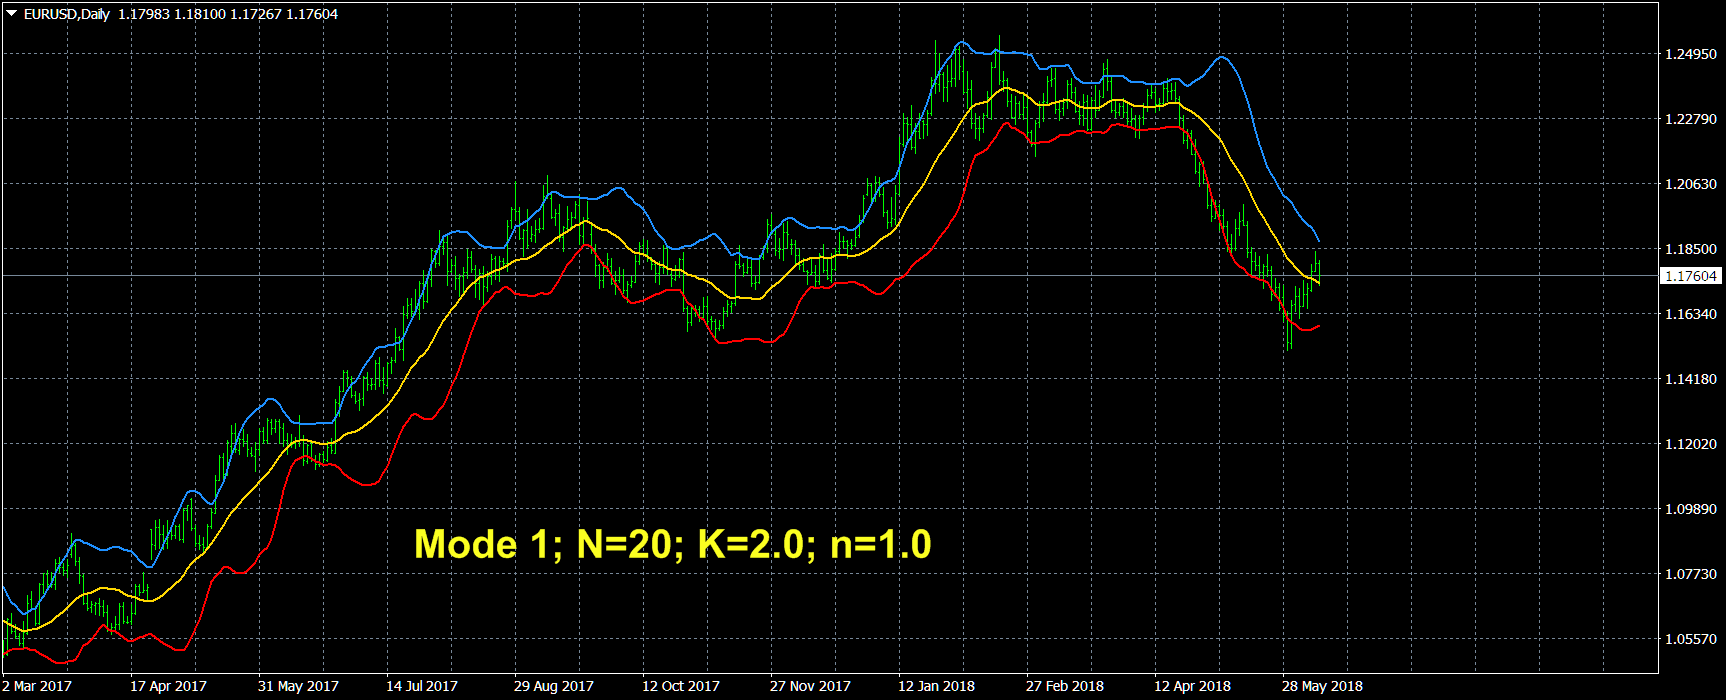
Fig. 3.
The lines became smoother, less responsive to price surges.
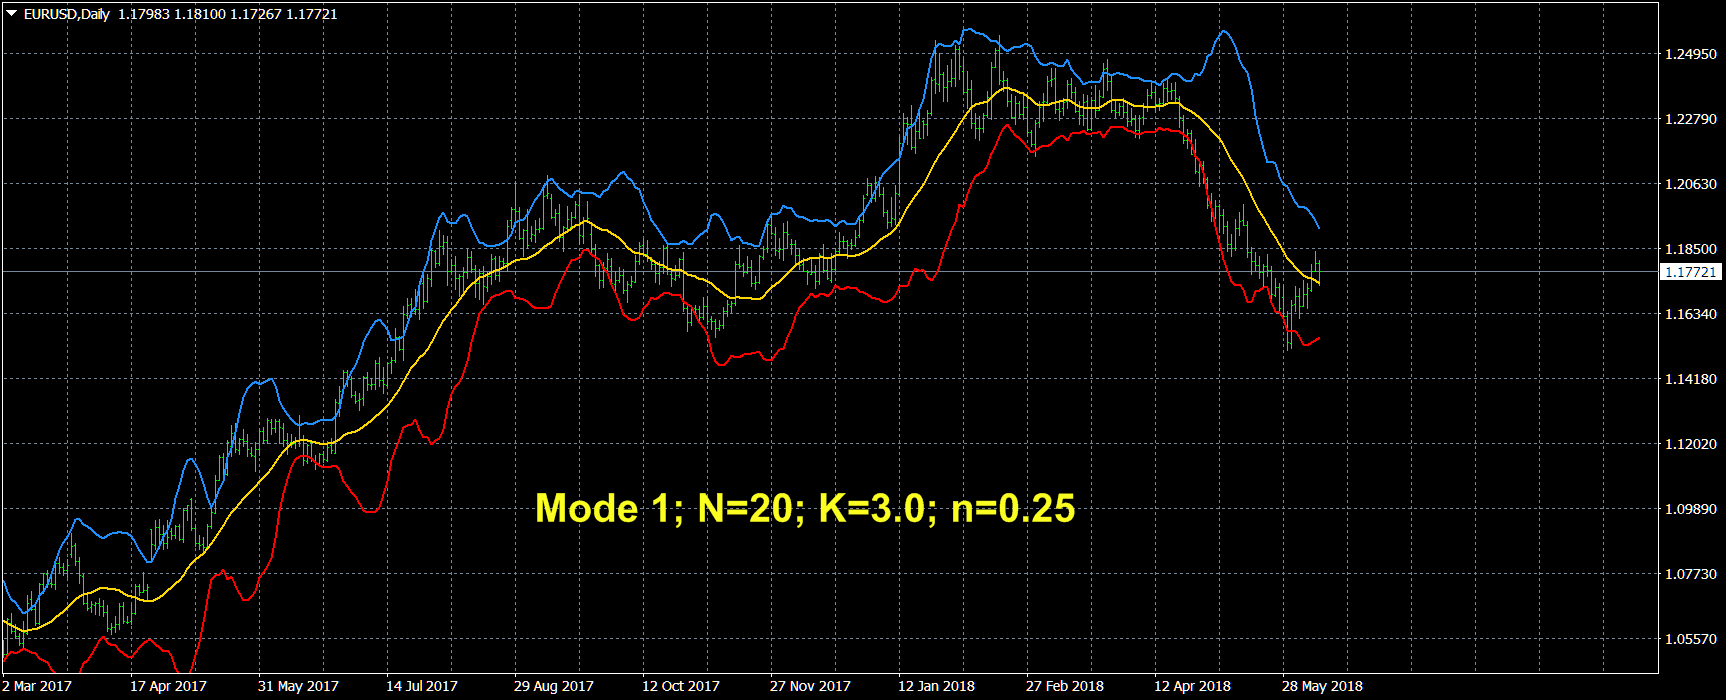
Fig. 4.
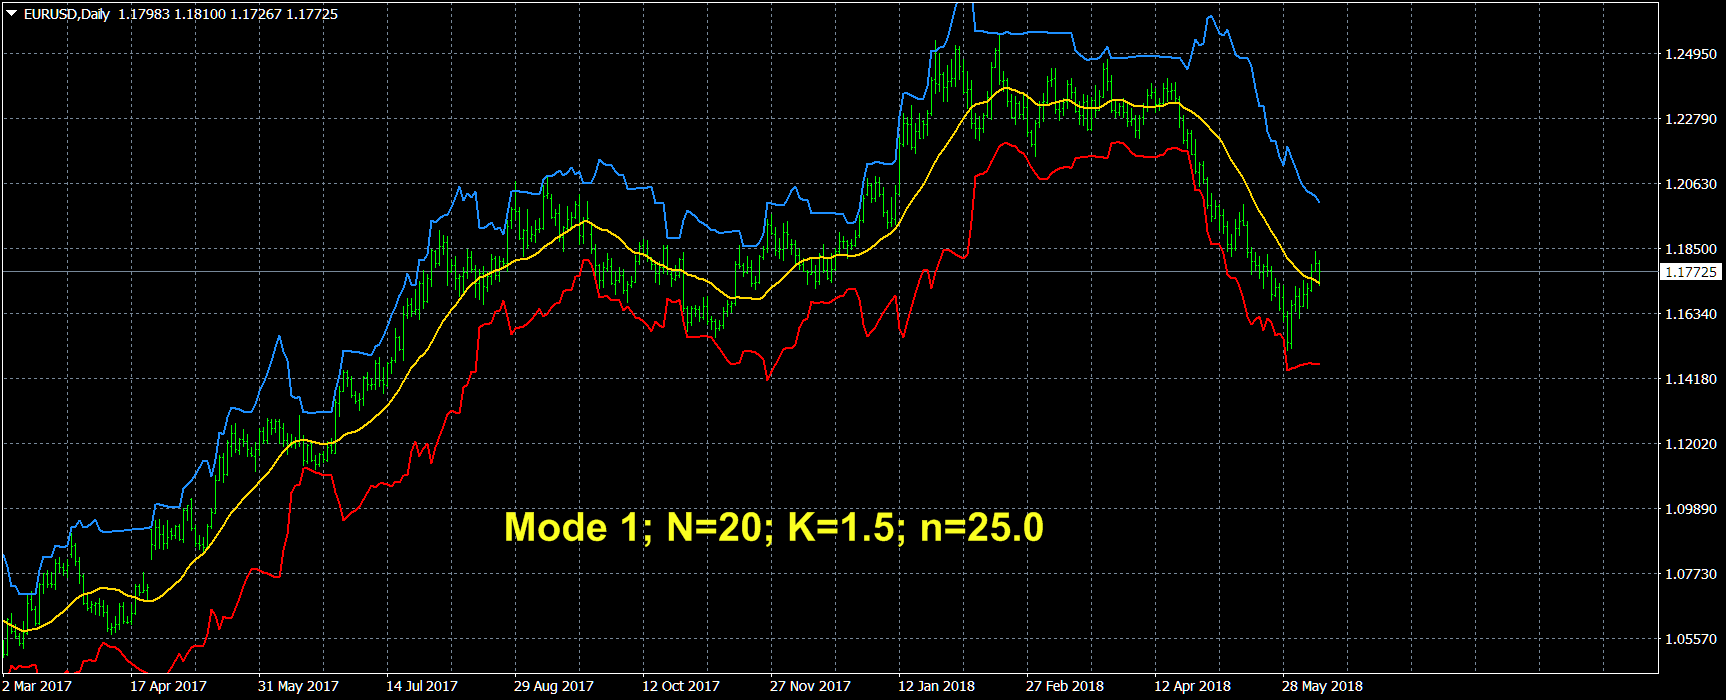
Fig. 5.
IB begins to draw straight sections of the channel lines and sharp, broken lines, indicating a change in the price direction, as in the Signal Bands indicator.
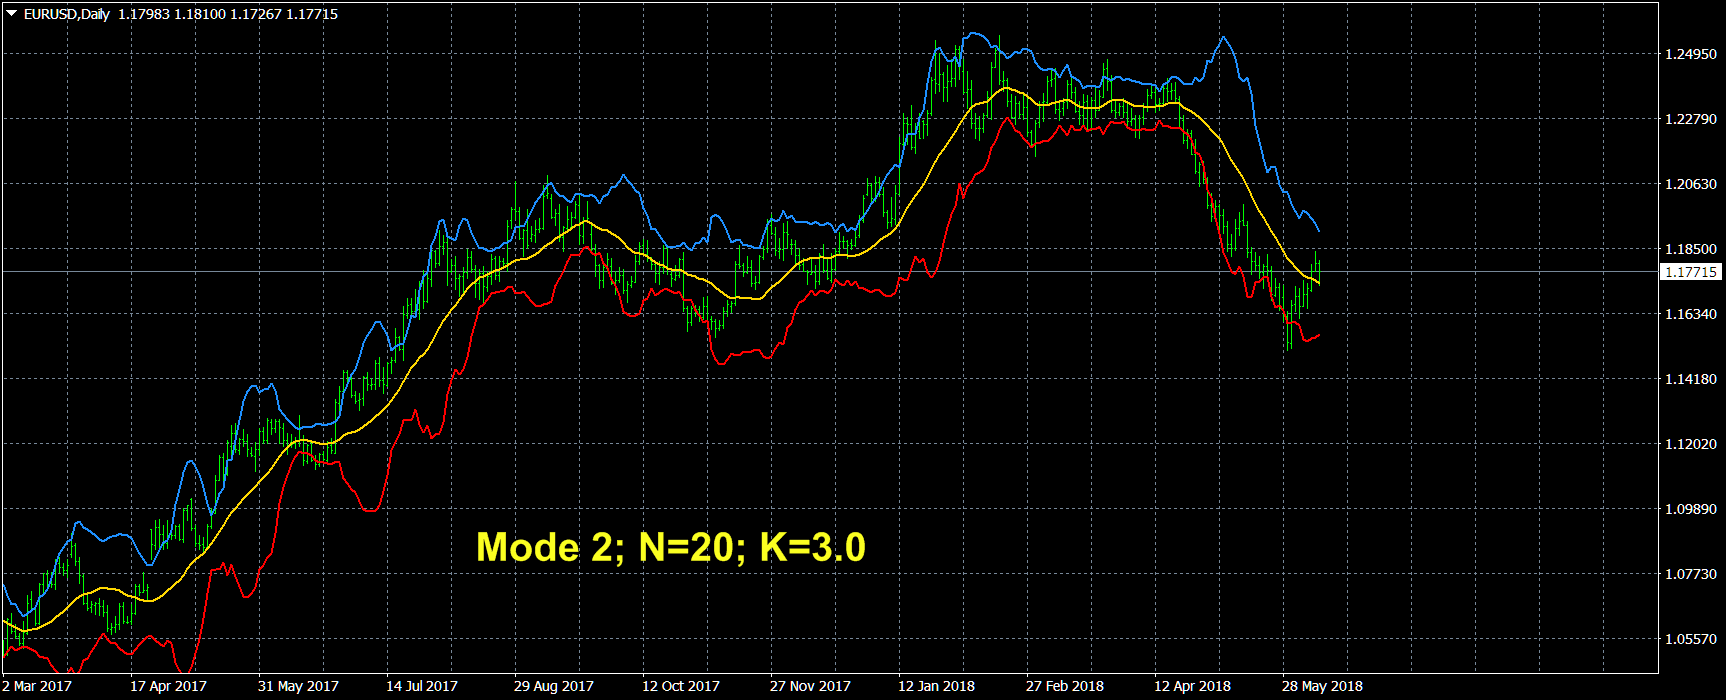
Fig. 6.
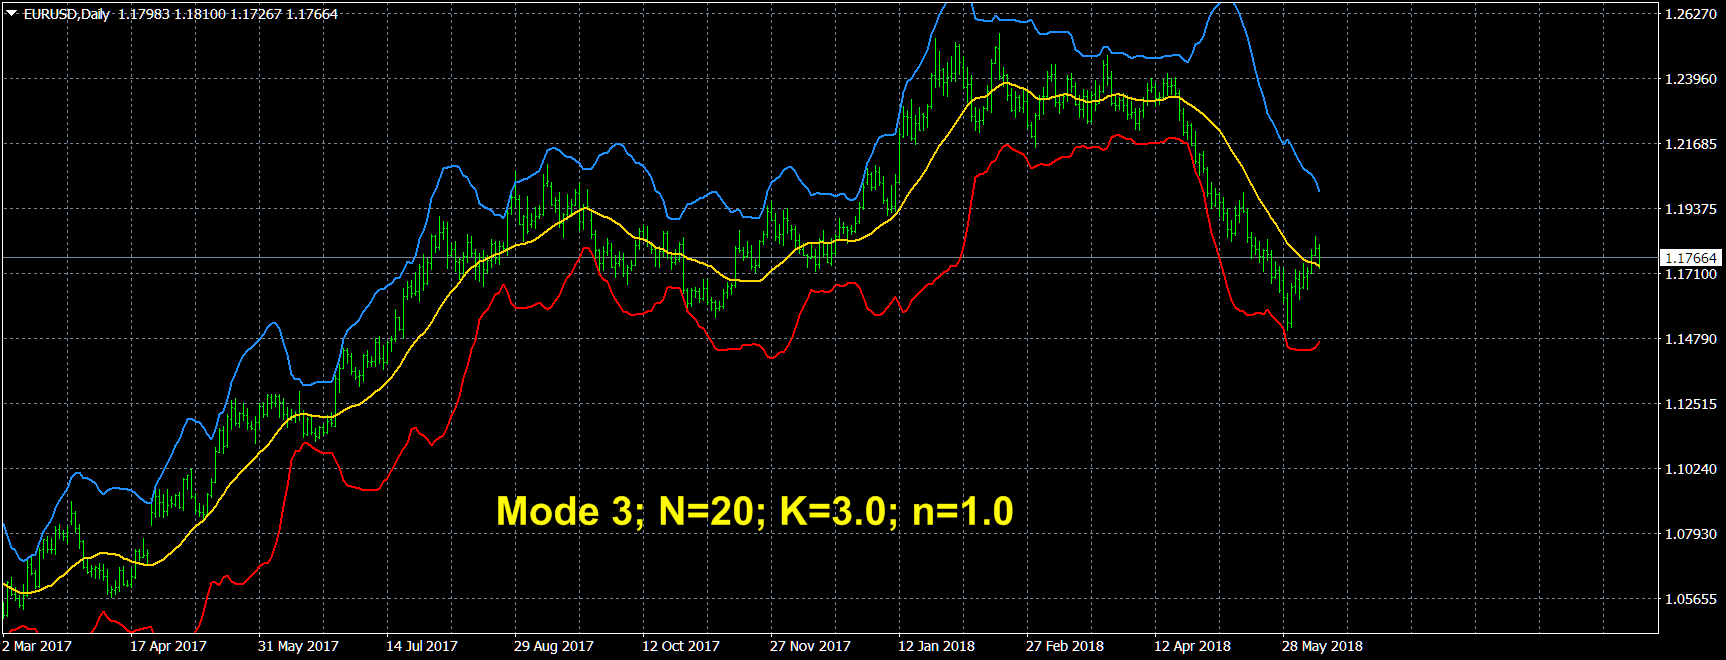
Fig. 7.

Fig. 8.
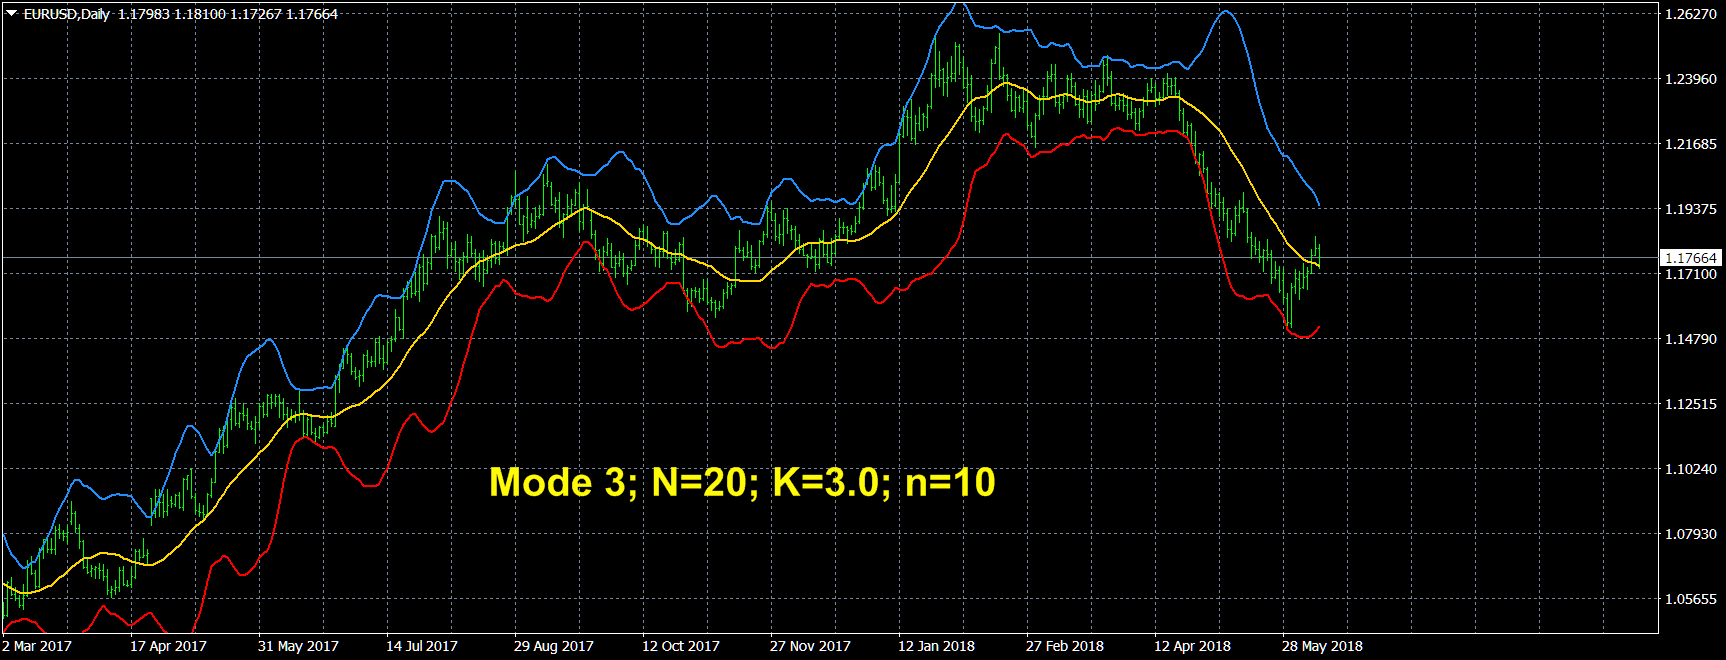
Fig. 9.

Fig. 10.

Fig. 11.
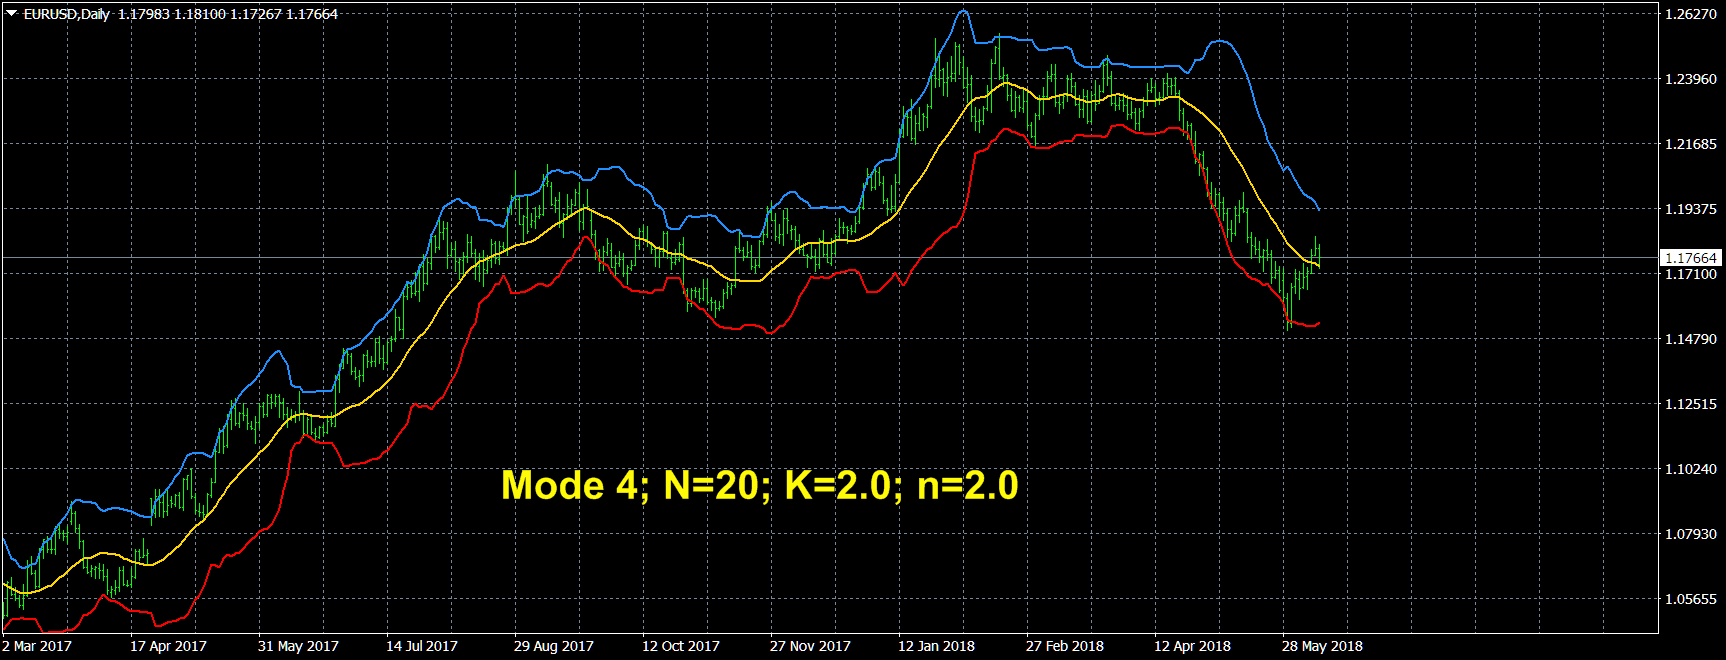
Fig. 12.
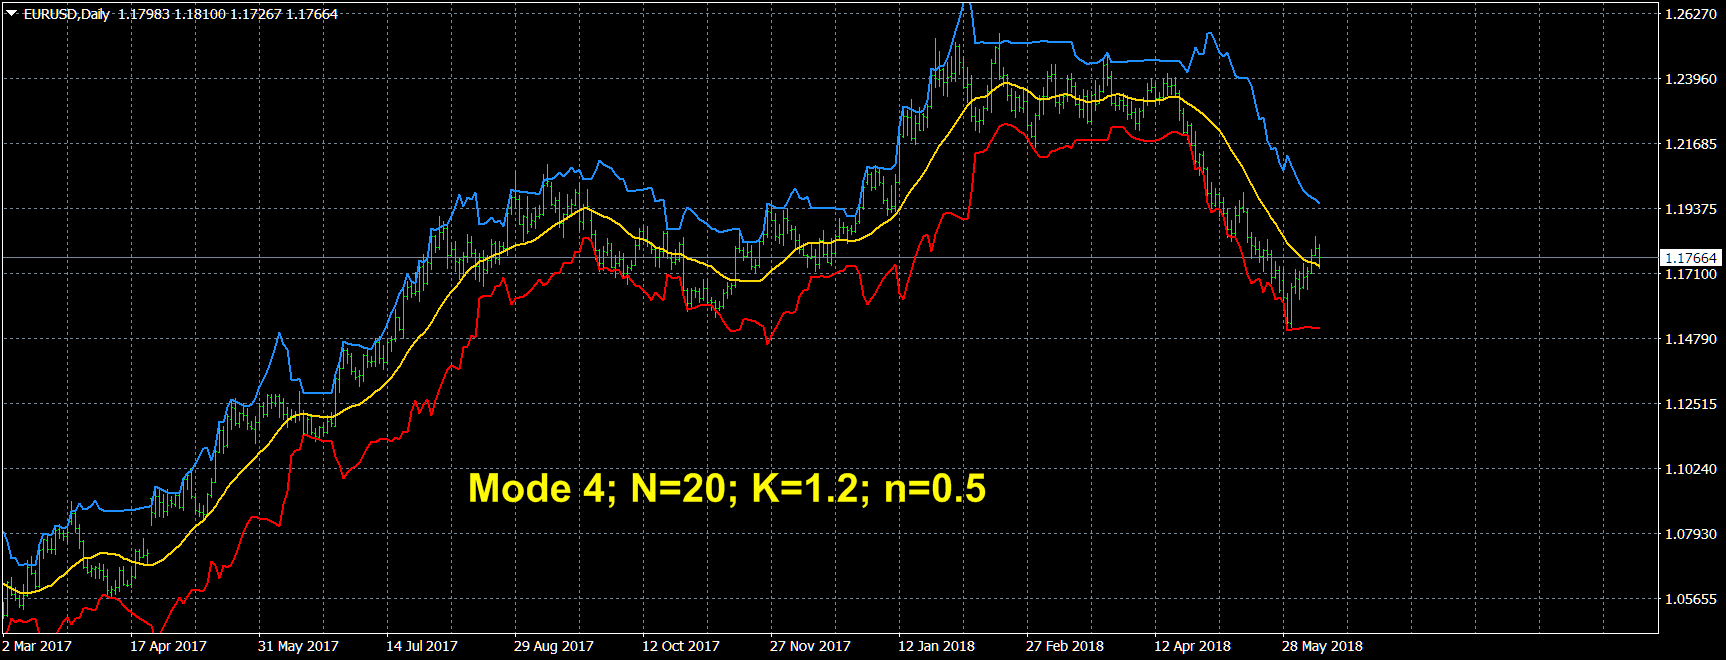
Fig. 13.
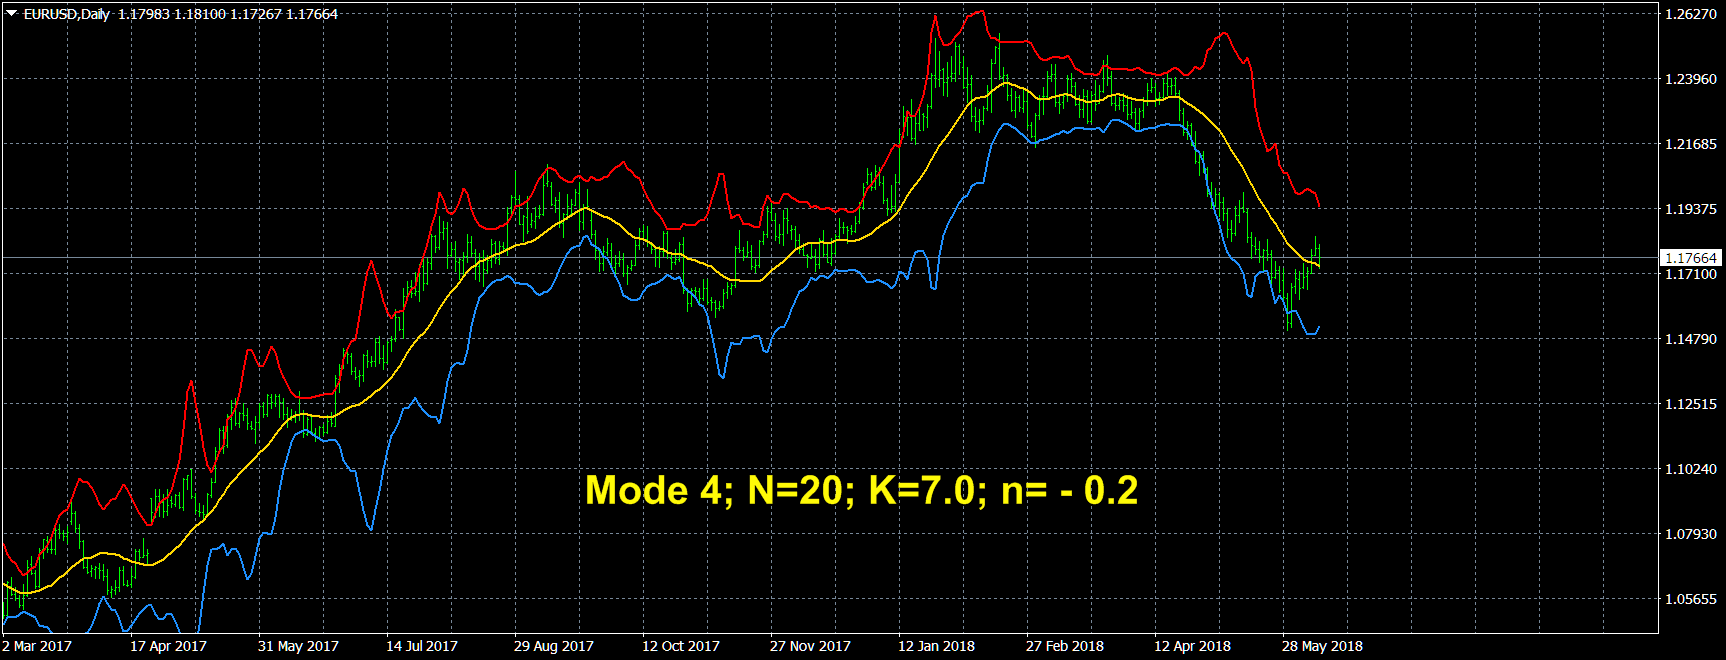
Fig. 14.
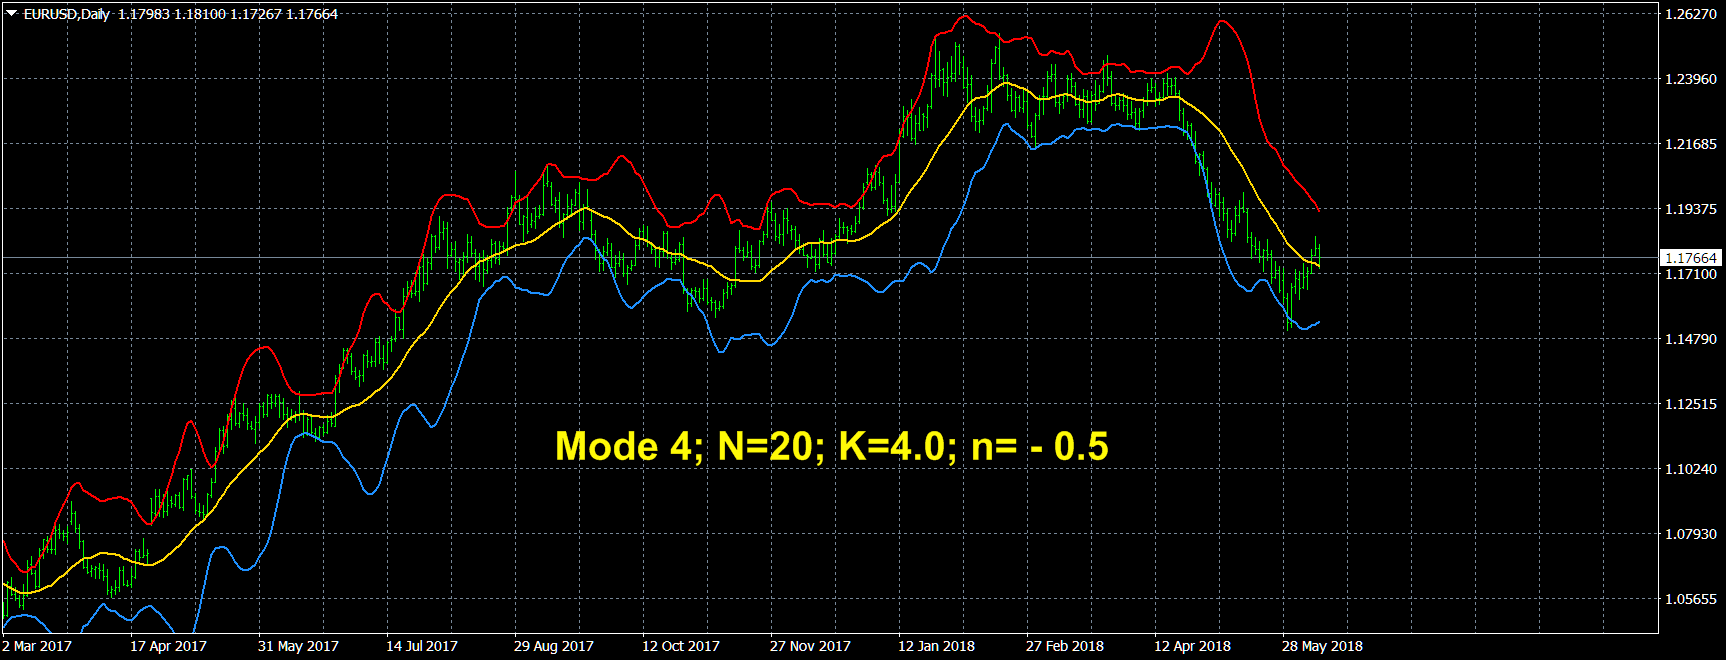
Fig. 15.
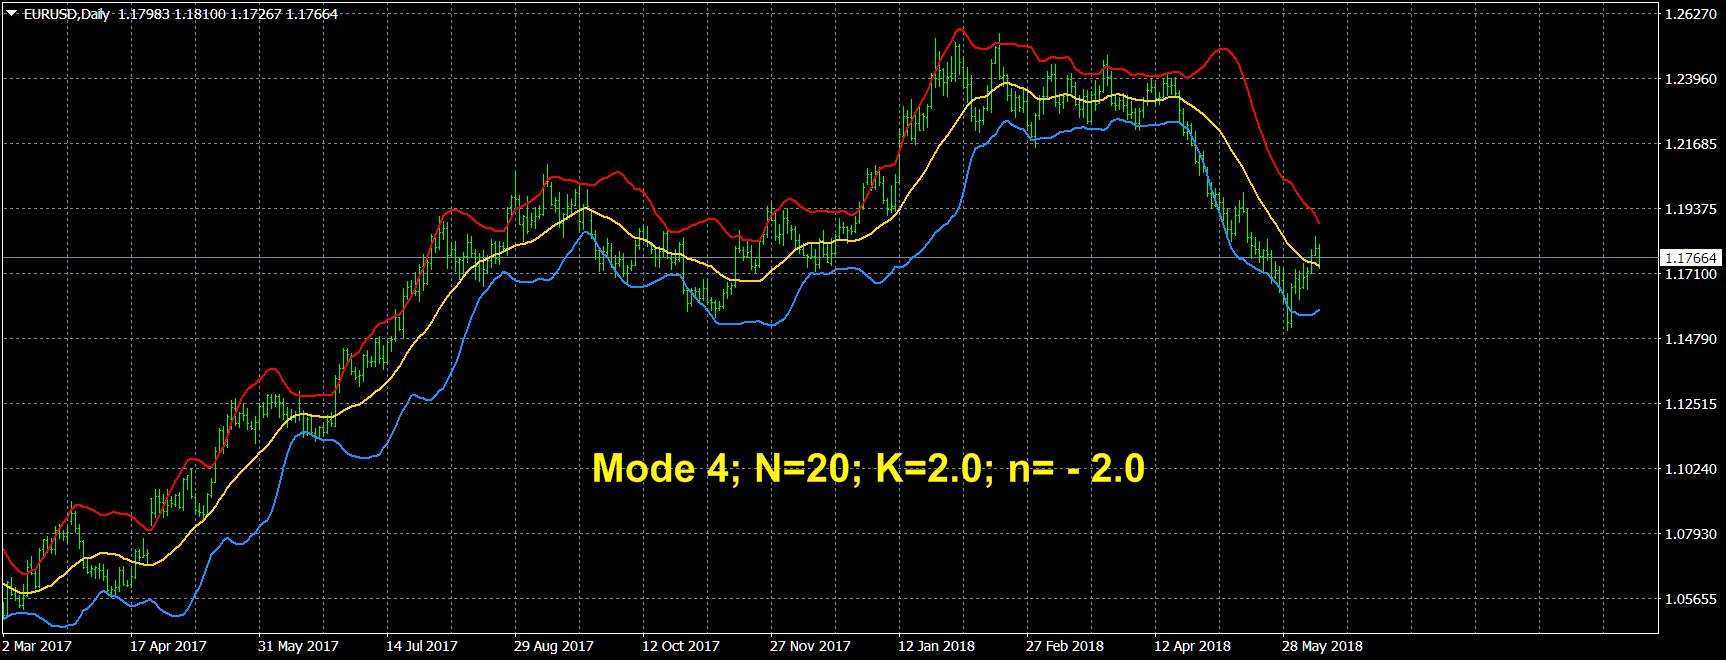
Fig. 16.

Fig. 17.
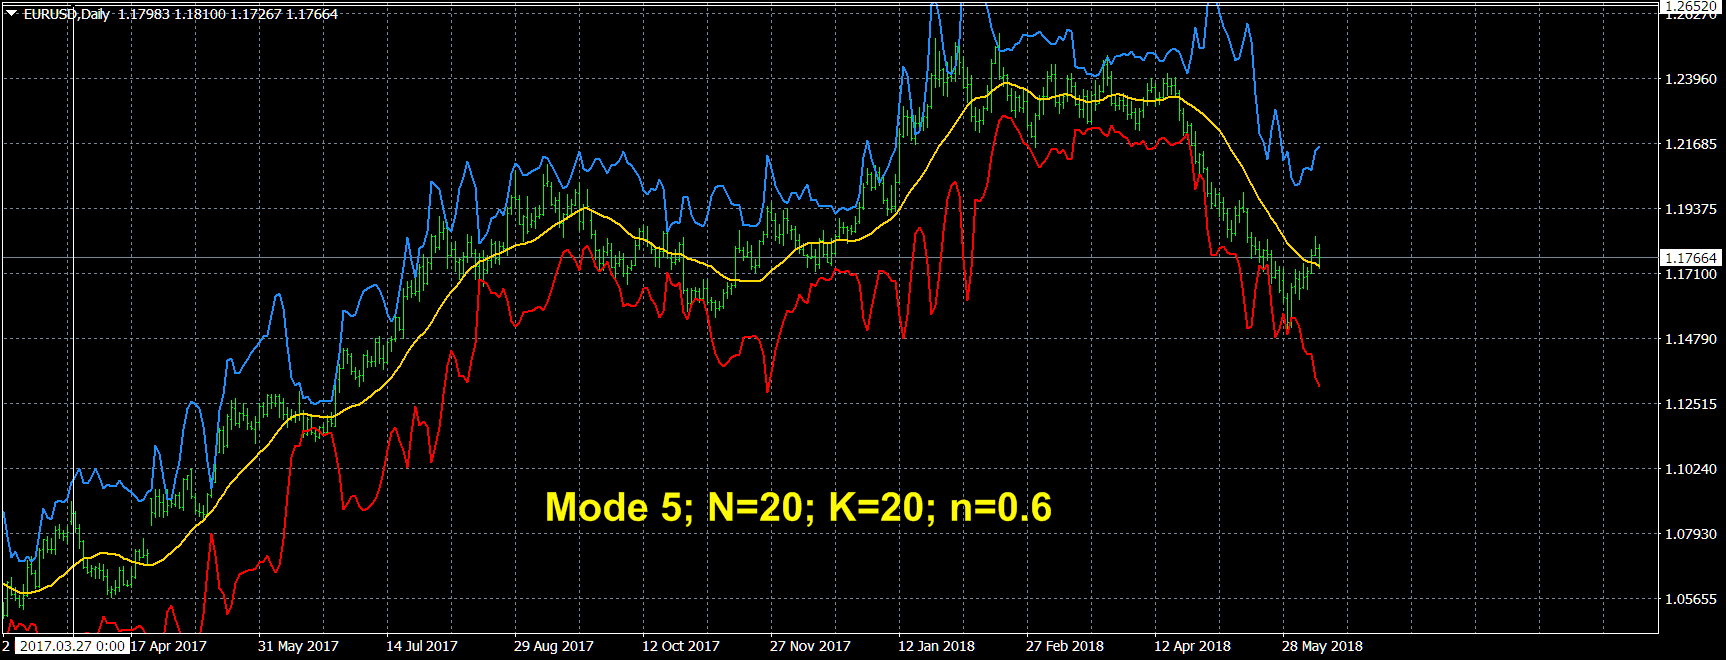
Fig. 18.
The sharp peaks of the lines signal a change in the direction of the price movement, as in the Signal Bands indicator.
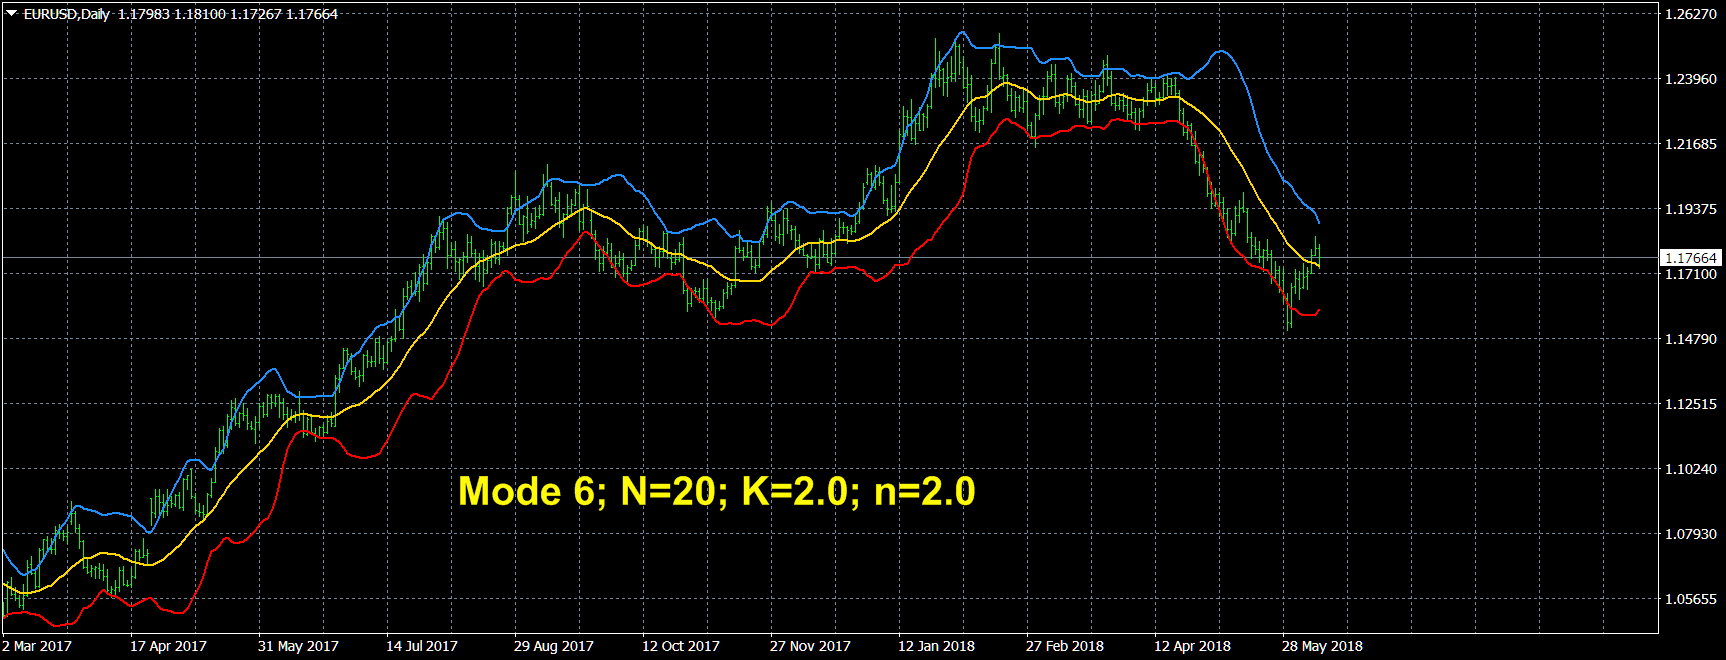
Fig. 19.
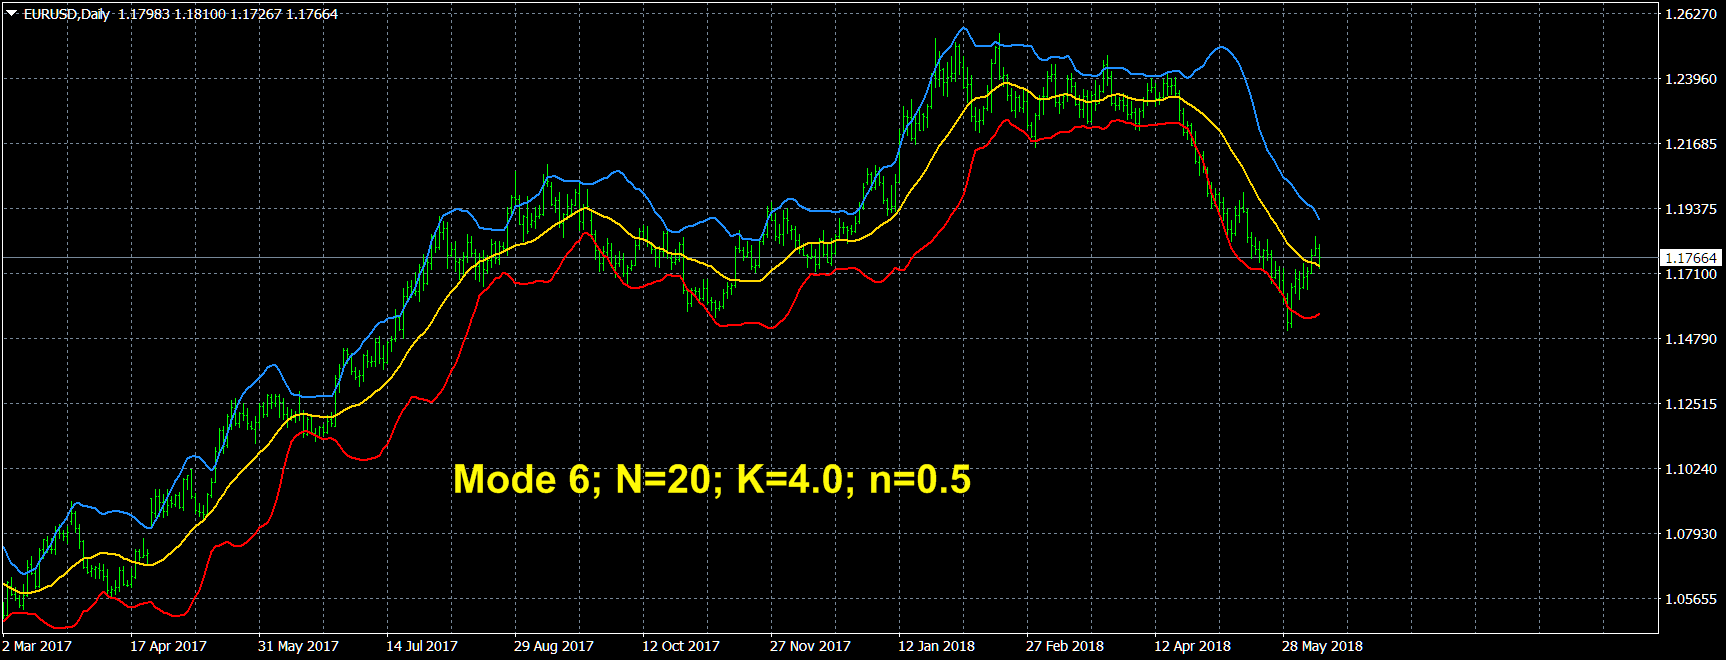
Fig. 20.
You can download a free new generalization of the IB indicator, called Channel Builder, via the link. (Channel Builder)


 & AMD Framework")
")