
It is not difficult to
lose the bigger picture of the Sector's performance and stock price
dynamics behind the day-to-day noise (and pain) of stock price
volatility. It may be helpful, therefore, to take a step back and figure
out where are we in this correction, what has been driving it, and are
the stock prices behaving rationally.
Correction Scorecard Segment By Segment
The
following graph shows, in a summary format, relative performance of
various groups of equities in the Oil & Gas sector, grouped by size
and primary commodity focus, over the past three-four months. The
highest price during this period for each individual stock or commodity
contract (the "recent peak" price) is specific to each stock and is used
as the starting point to calculate the "recent-peak-to-current"
decline. (Therefore, the average declines for each group of stocks shown
on the graph are not the same thing as the average declines for indices
consisting of the same stocks over a specific period of time.)
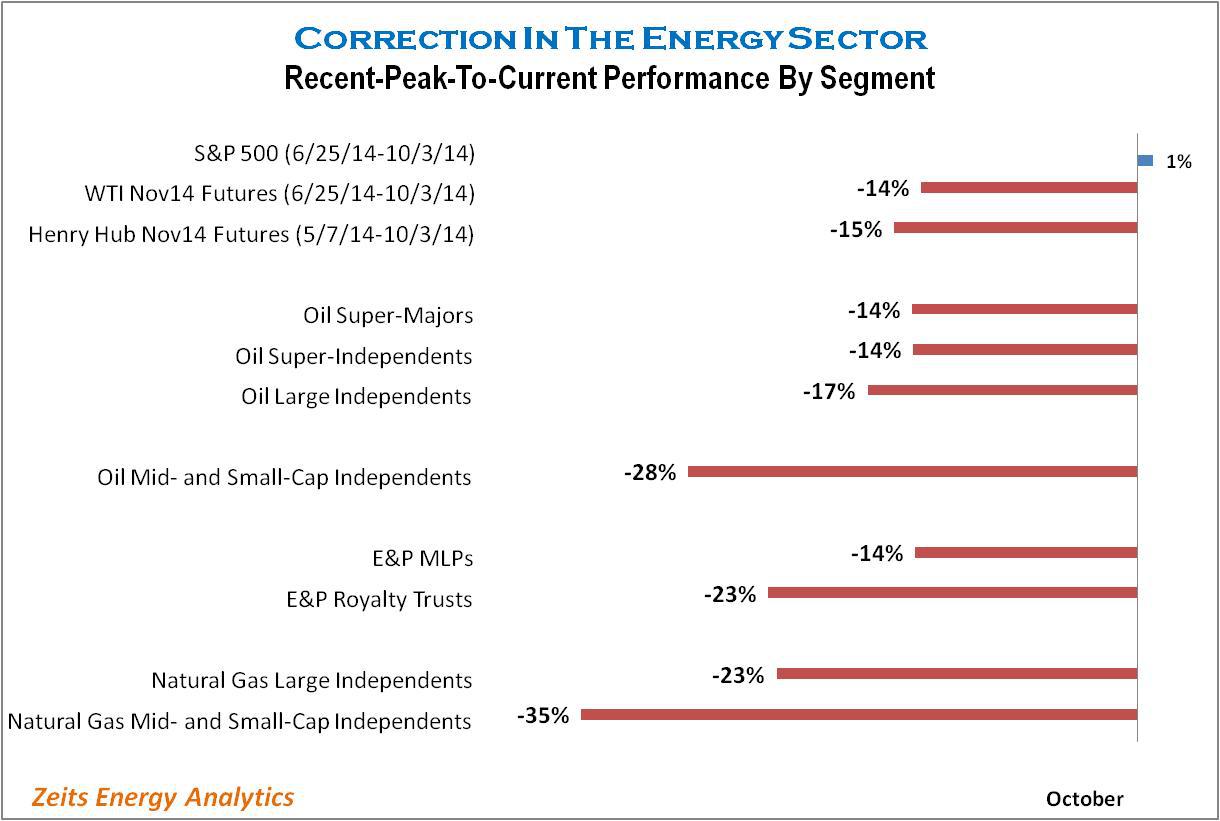
The first important conclusion from this comparison is that the correction in the Oil & Gas Sector has not been driven by the overall decline in the market. The S&P 500 index, in fact, posted a minor gain since the end of June, whereas typical declines among Oil & Gas stocks ranged in the 14%-35% range.
The second important conclusion is that large-capitalization stocks - which represent the vast majority of publicly traded capital deployed in the Oil & Gas Sector - had declines that are very similar in percentage terms to the declines posted by the key commodity benchmarks.
Equity-Commodity Correlation Is Very Pronounced
A closer review of this correction's structure indicates that there is a very tight connection between the stocks' performance and the changes in the direction of the relevant underlying commodity.
It is worth noting that natural gas-focused stocks peaked and started "rolling over" more than a month before the oil-focused groups peaked: the prices of gas-focused stocks were falling at the same time as the prices of oil-focused stocks were still rising.
The beginning of the correction in the gas-focused segment coincided almost precisely with the moment when the "stimulus" in natural gas price caused by the unexpected storage drawdown during the abnormally cold winter season started disappearing.
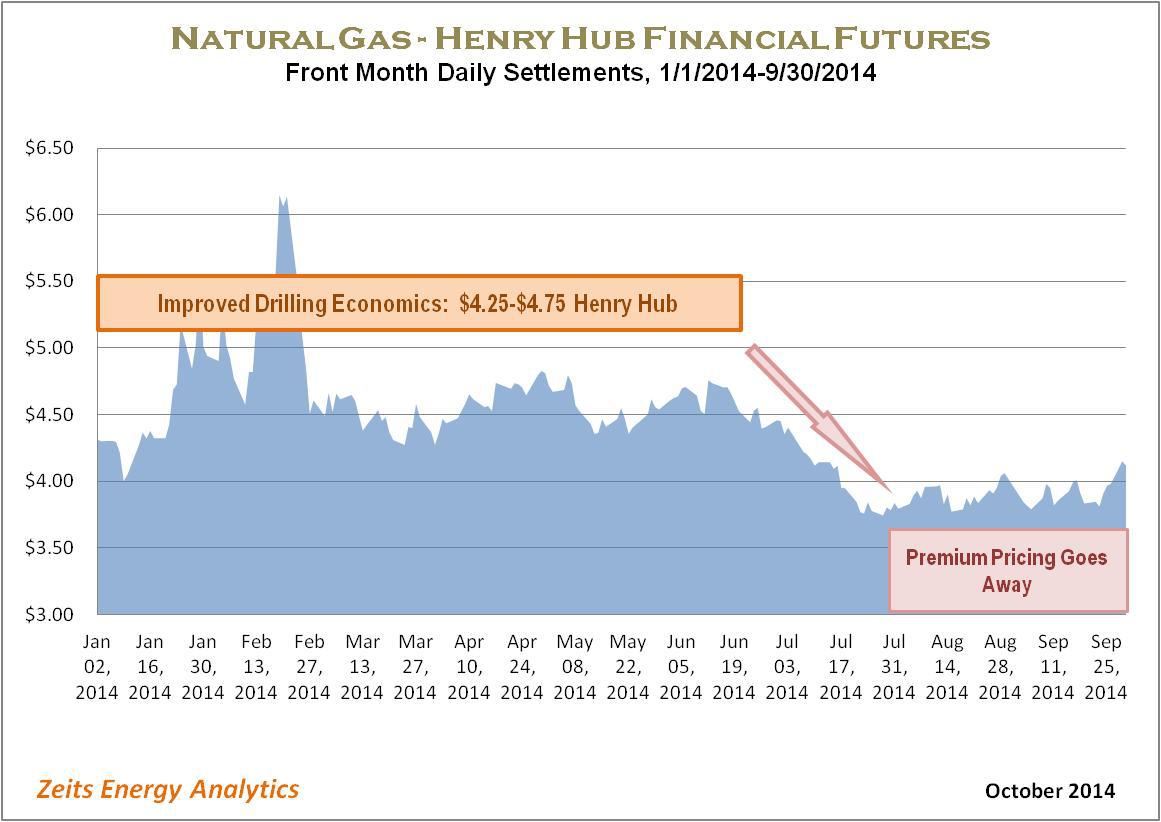
The timing of the correction in the natural gas-focused stocks group indicates that natural gas price dynamics were, as one would expect, the primary factor behind the stocks' decline.
Of note, the declines among natural gas stocks have been very deep, even for companies with competitive asset bases, significant capitalizations and strong balance sheets. Just to give several examples of recent-peak-to-current declines:
- Cabot Oil & Gas: -21%
- Southwestern Energy: -29%
- Range Resources: - 29%
- Chesapeake Energy: - 26%
The correlation between oil-focused E&P stocks, particularly in the mid- and small-capitalization group, and the direction of crude oil price has been equally tight. The following graph shows that crude oil prices reached a peak around June 23-25. Remarkably, these were precisely the dates when the majority of U.S. oil-focused E&P stocks saw their recent peaks.


 Trading Guide")

