 Indicator")

Product Available here:
https://www.mql5.com/en/market/product/145087/
Features
- Three Hull MA Variations: Classic HMA, Exponential HMA (EHMA), and Triangular HMA (THMA)
- Multi-Timeframe Support: View higher timeframe Hull MA on any chart
- Dynamic Color Coding: Automatic trend-based color switching for easy visualization
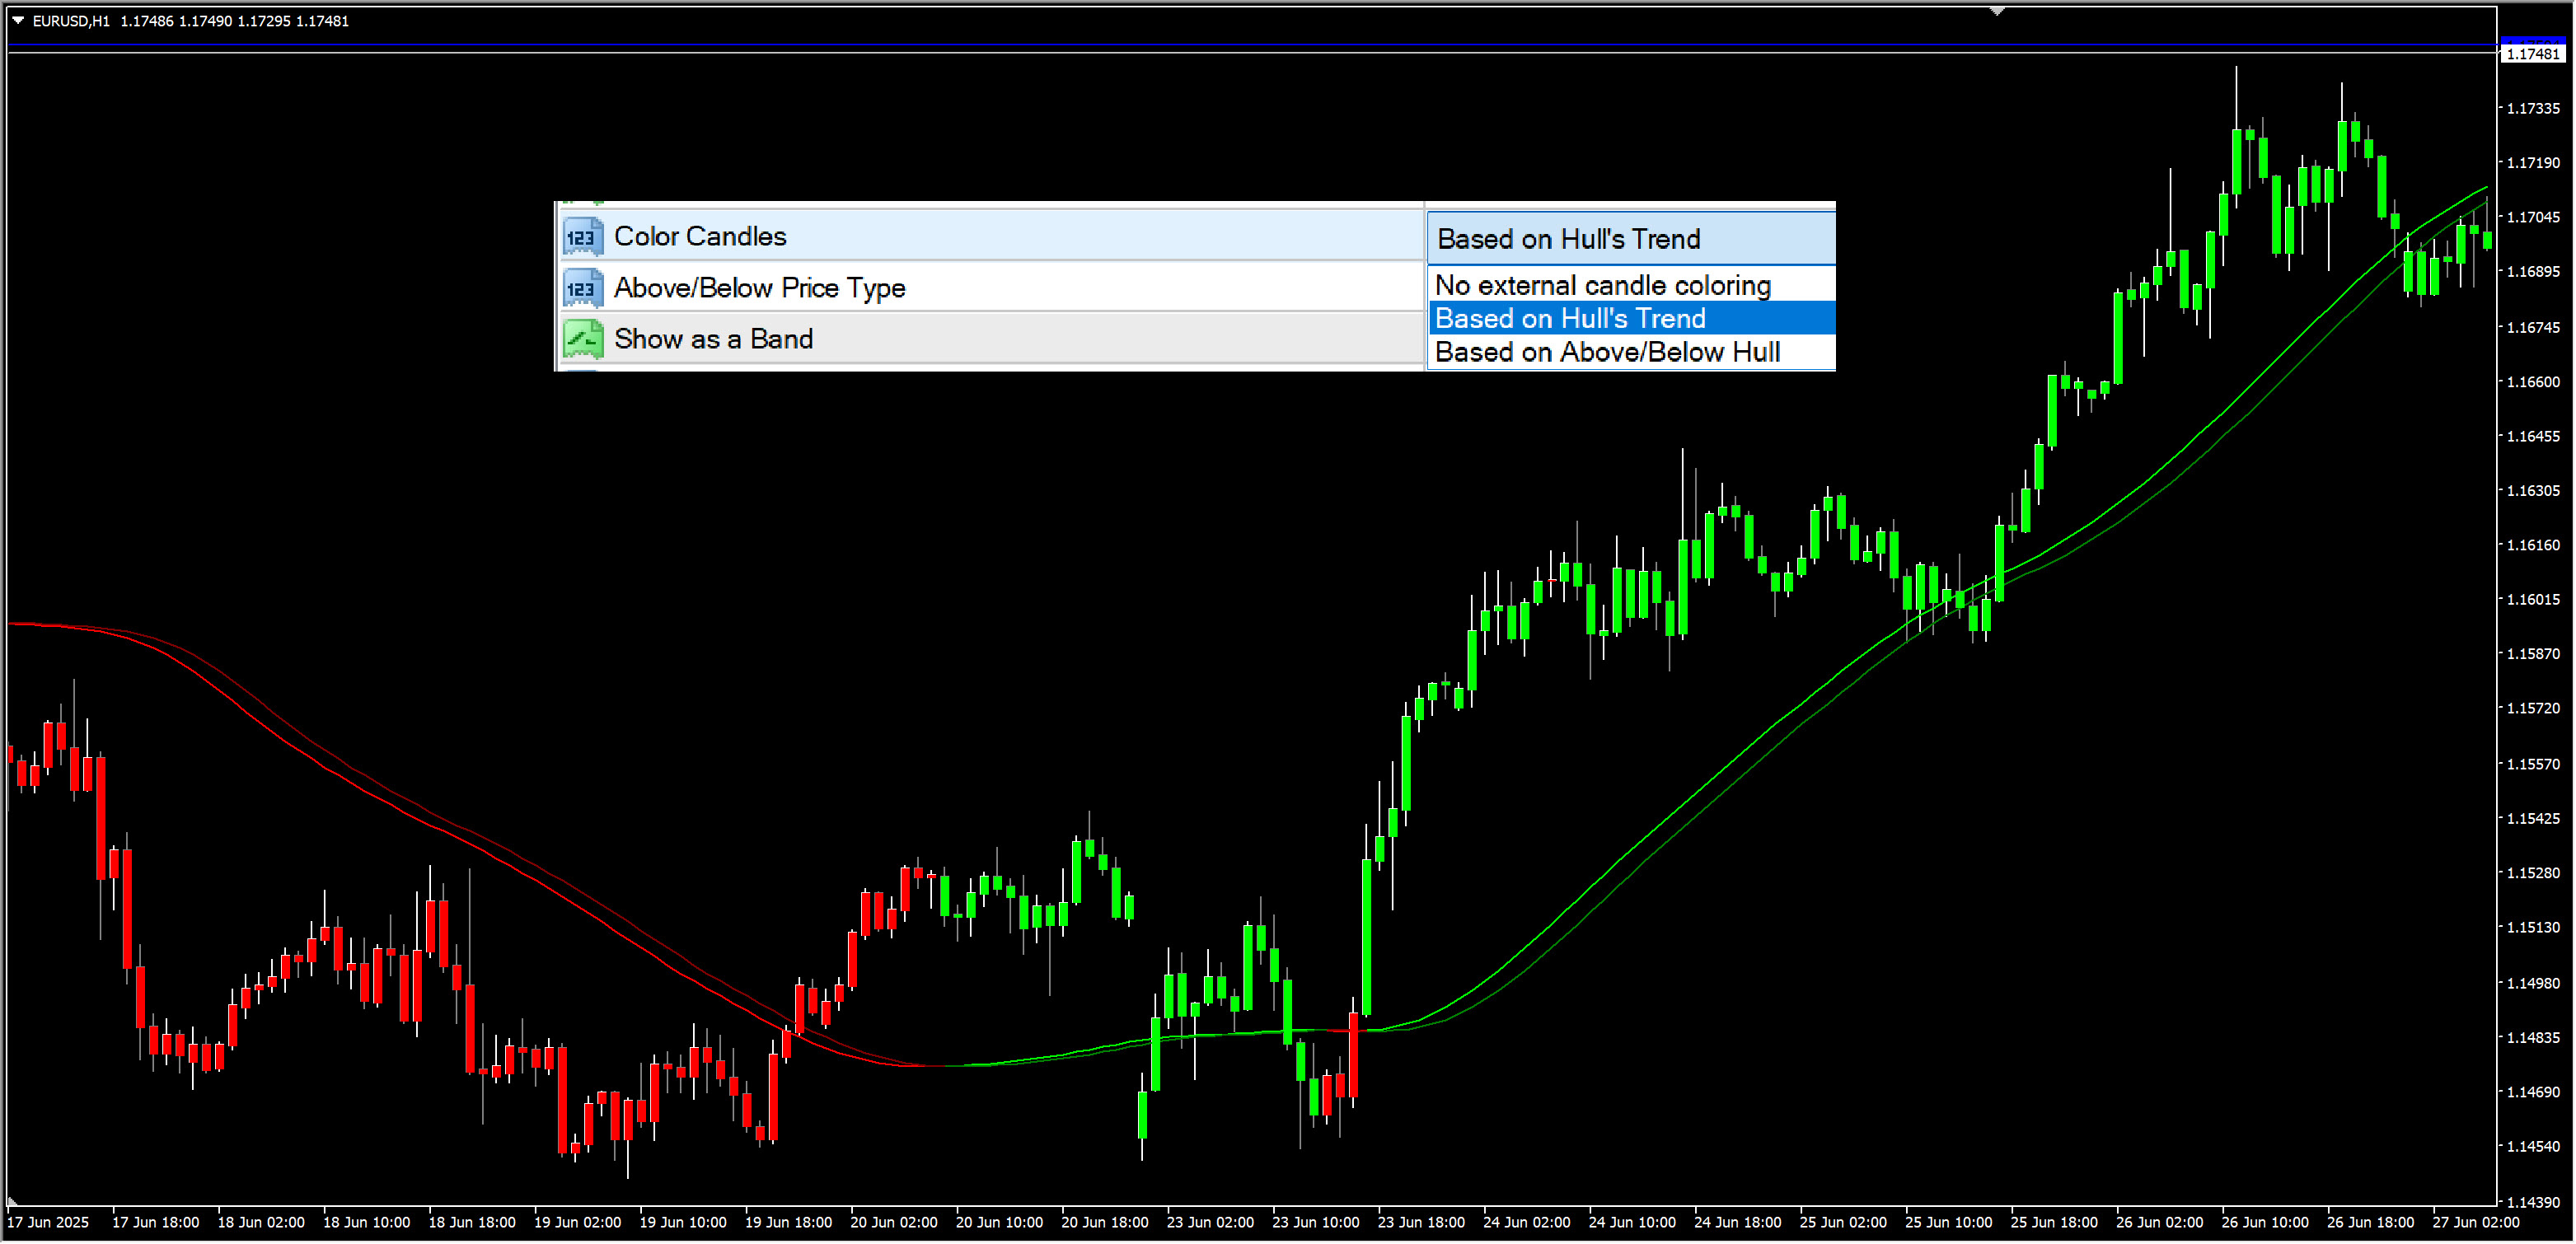
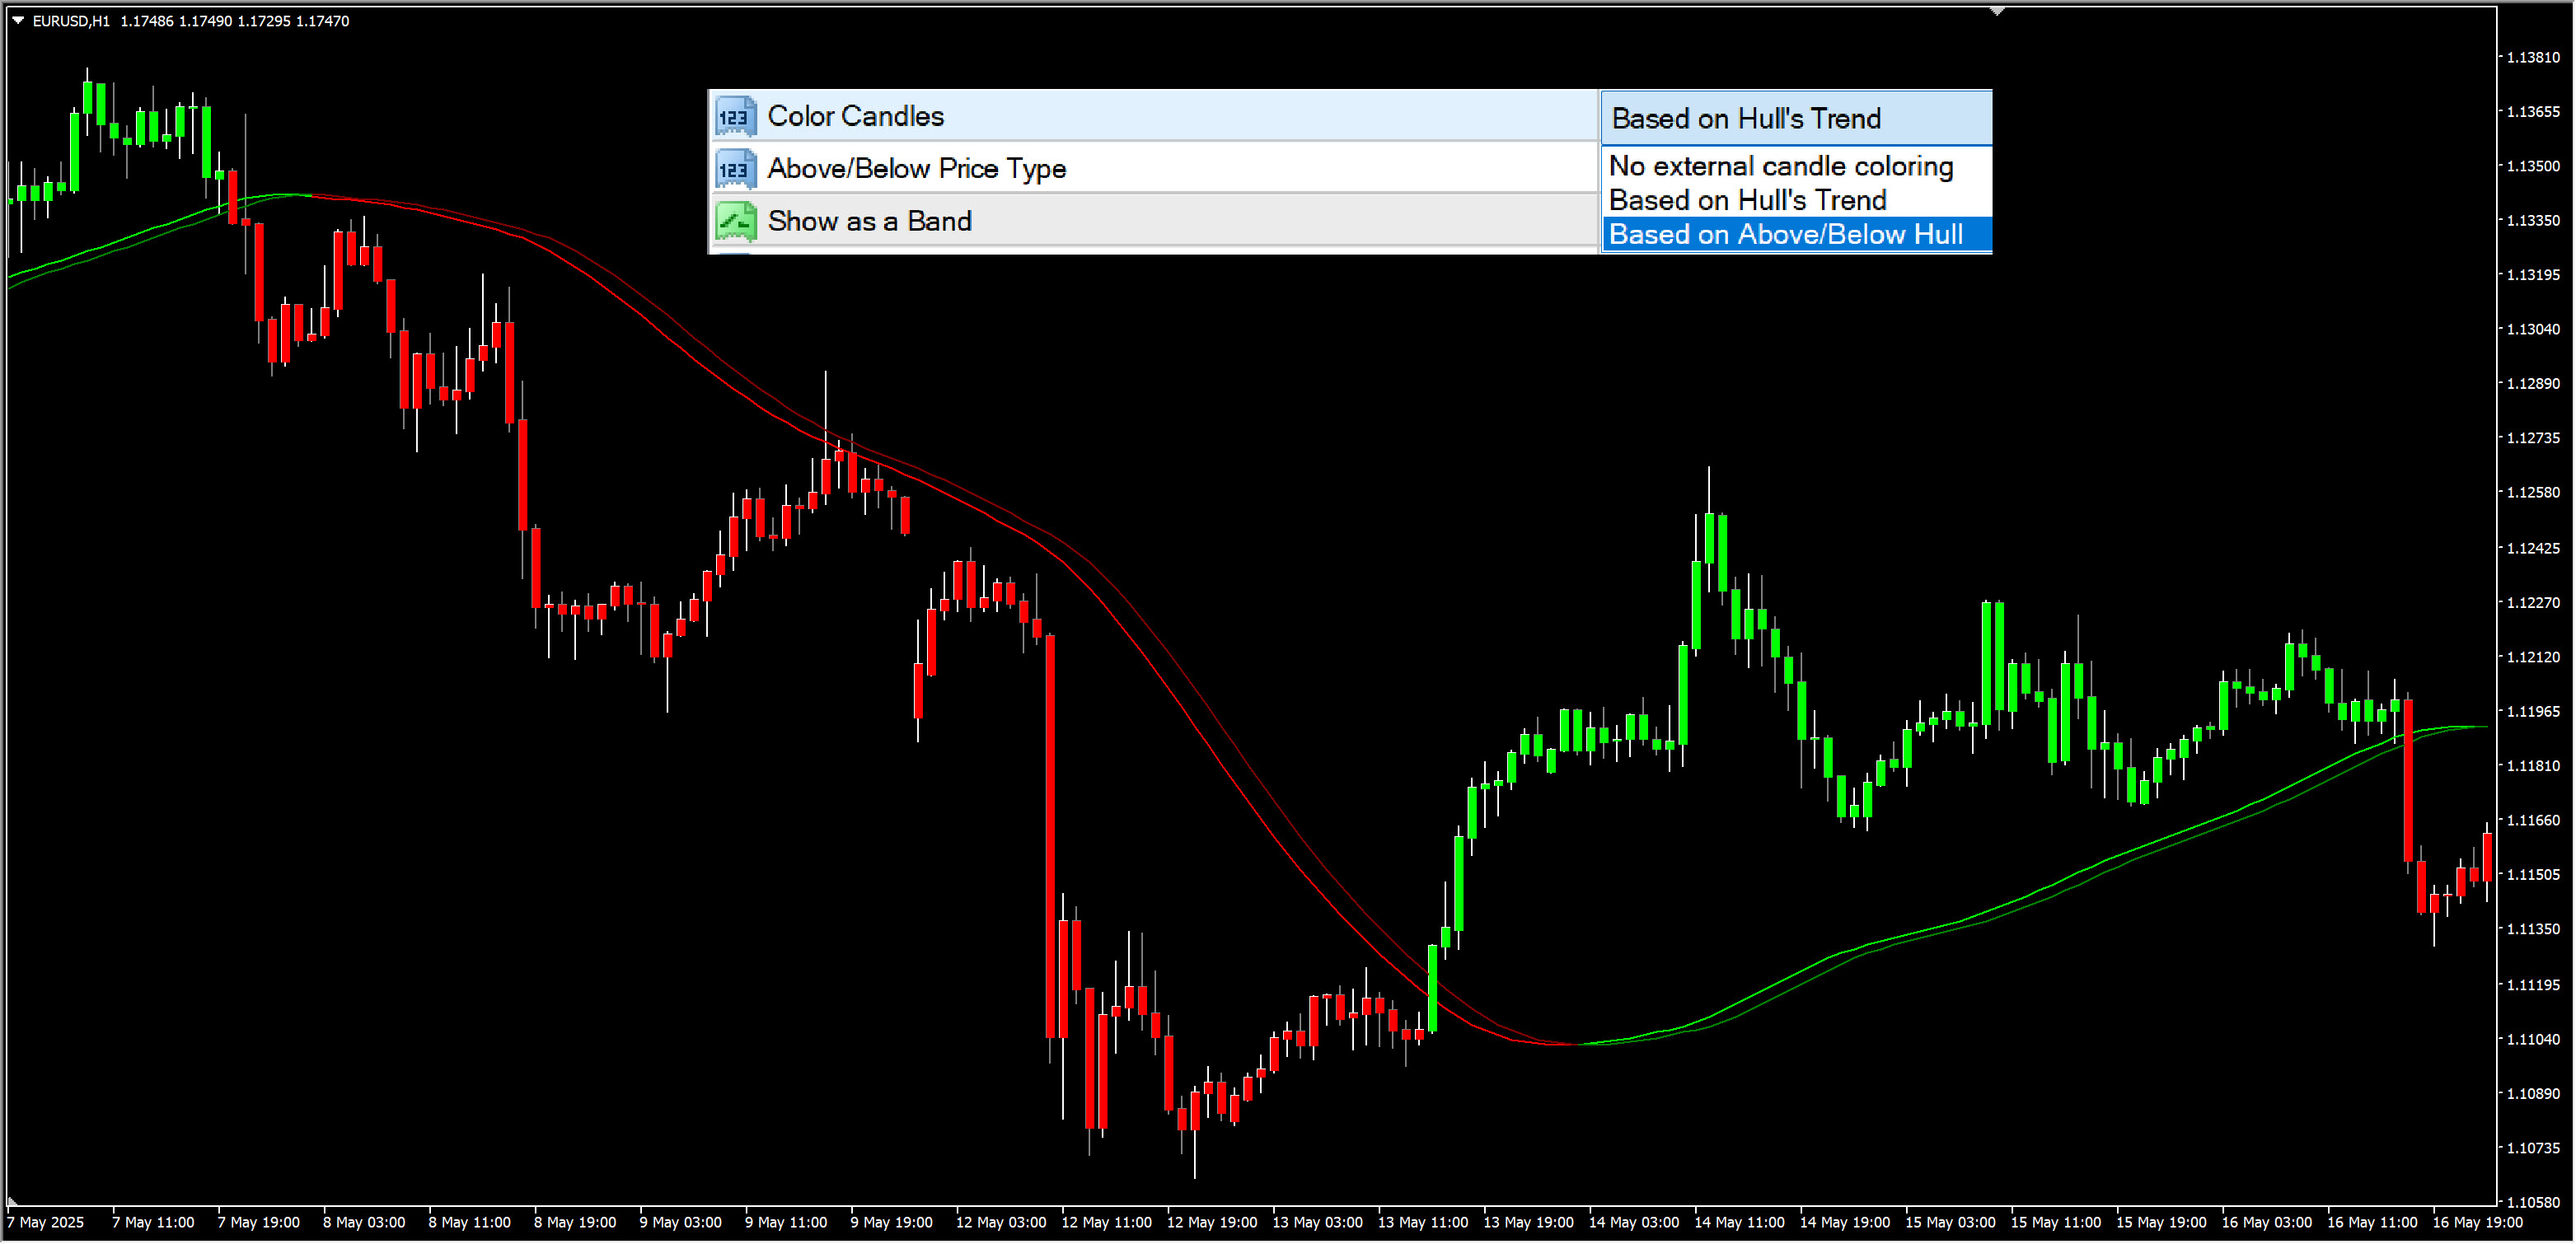
- Candle Body Coloring: Color candle bodies based on Hull trend or price position
- Real-Time Alerts: Get notified on trend changes and candle color switches
- Customizable Visuals: Adjustable colors, line thickness, and transparency
- Band Display Option: Show shifted Hull line for enhanced visual analysis
Price Coloring:
HMA Styles:
Hull Moving Average (HMA) The original Hull MA formula that reduces lag while maintaining smoothness. Perfect for trend following and swing trading setups.
Exponential Hull Moving Average (EHMA) Uses exponential smoothing instead of weighted averages, providing faster response to price changes while keeping the Hull formula benefits.
Triangular Hull Moving Average (THMA) A unique variation that uses triangular weighting, offering the smoothest signals with minimal false breakouts.
How to Use
Trend Identification: When the Hull line is green/lime, the trend is bullish. When red, the trend is bearish.
Entry Signals: Look for color changes from red to green for long entries, and green to red for short entries.
Use SR areas like from Pivots or Quarter Areas for entry and exit.
Multi-Timeframe Analysis: Set a higher timeframe (like H4 on M15 chart) to see the bigger picture trend while trading on lower timeframes.
Candle Coloring: Enable candle body coloring to instantly see if price is above or below the Hull line, or following the Hull trend direction.
Settings:
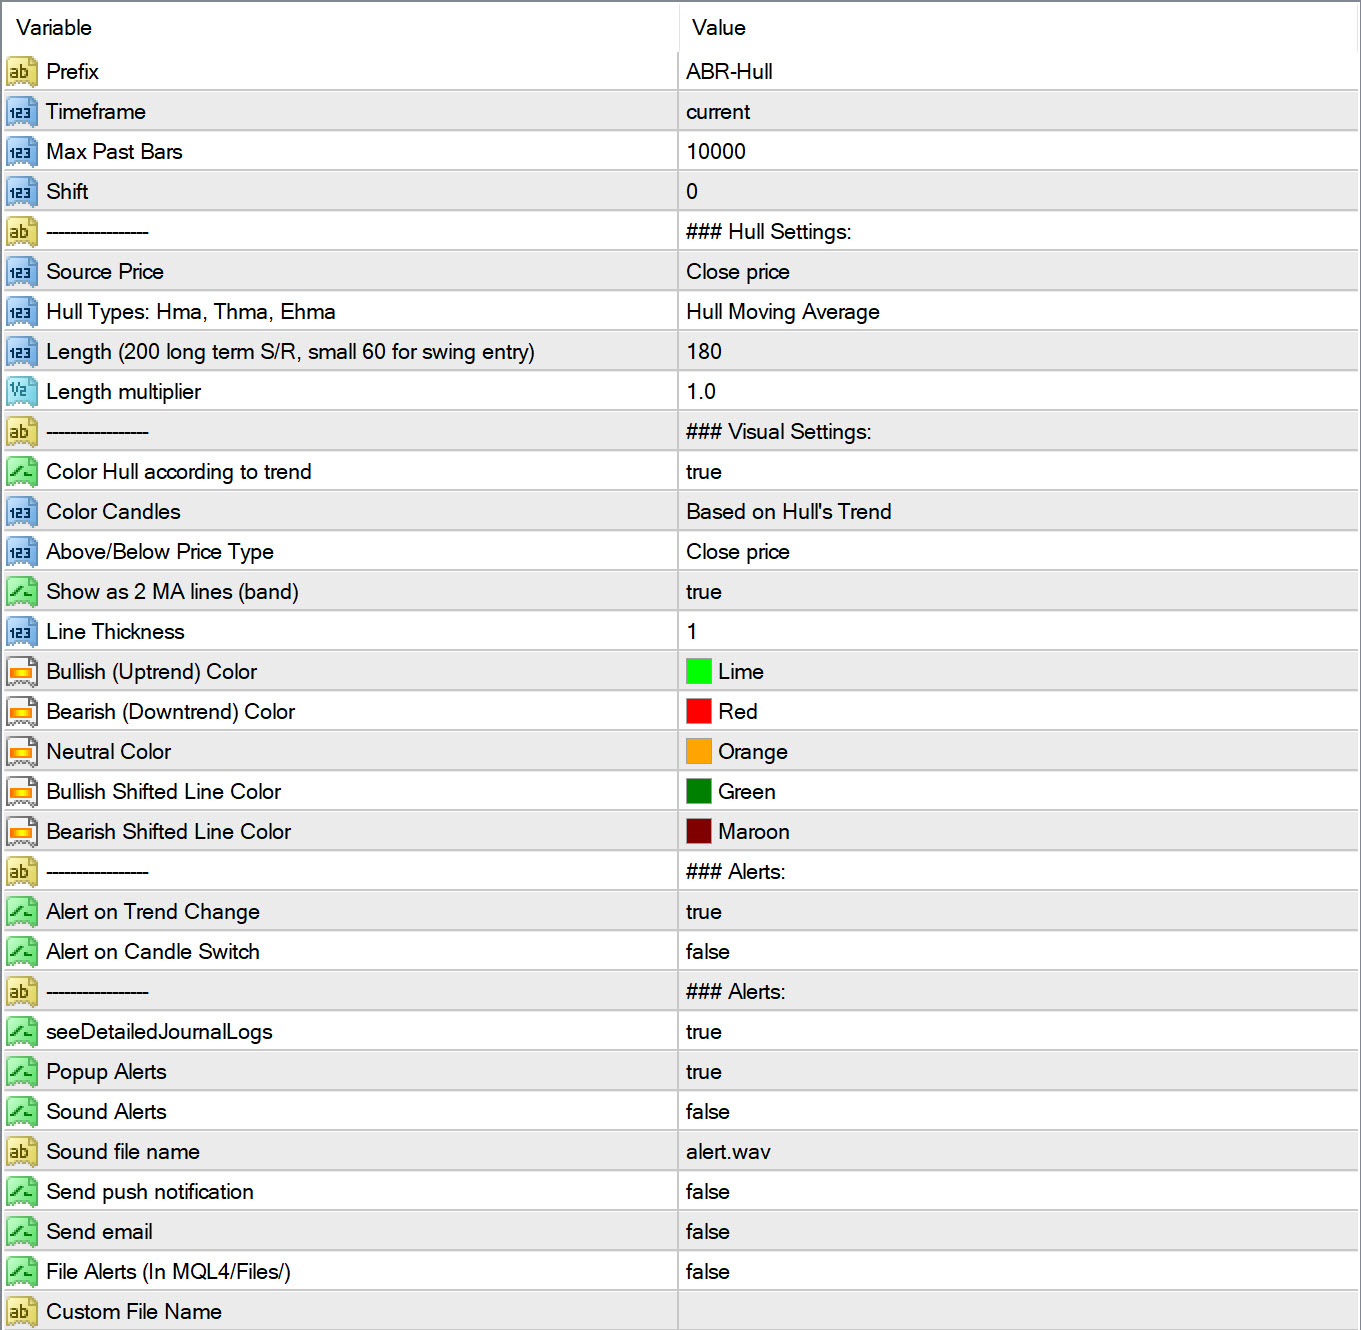
Hull Settings
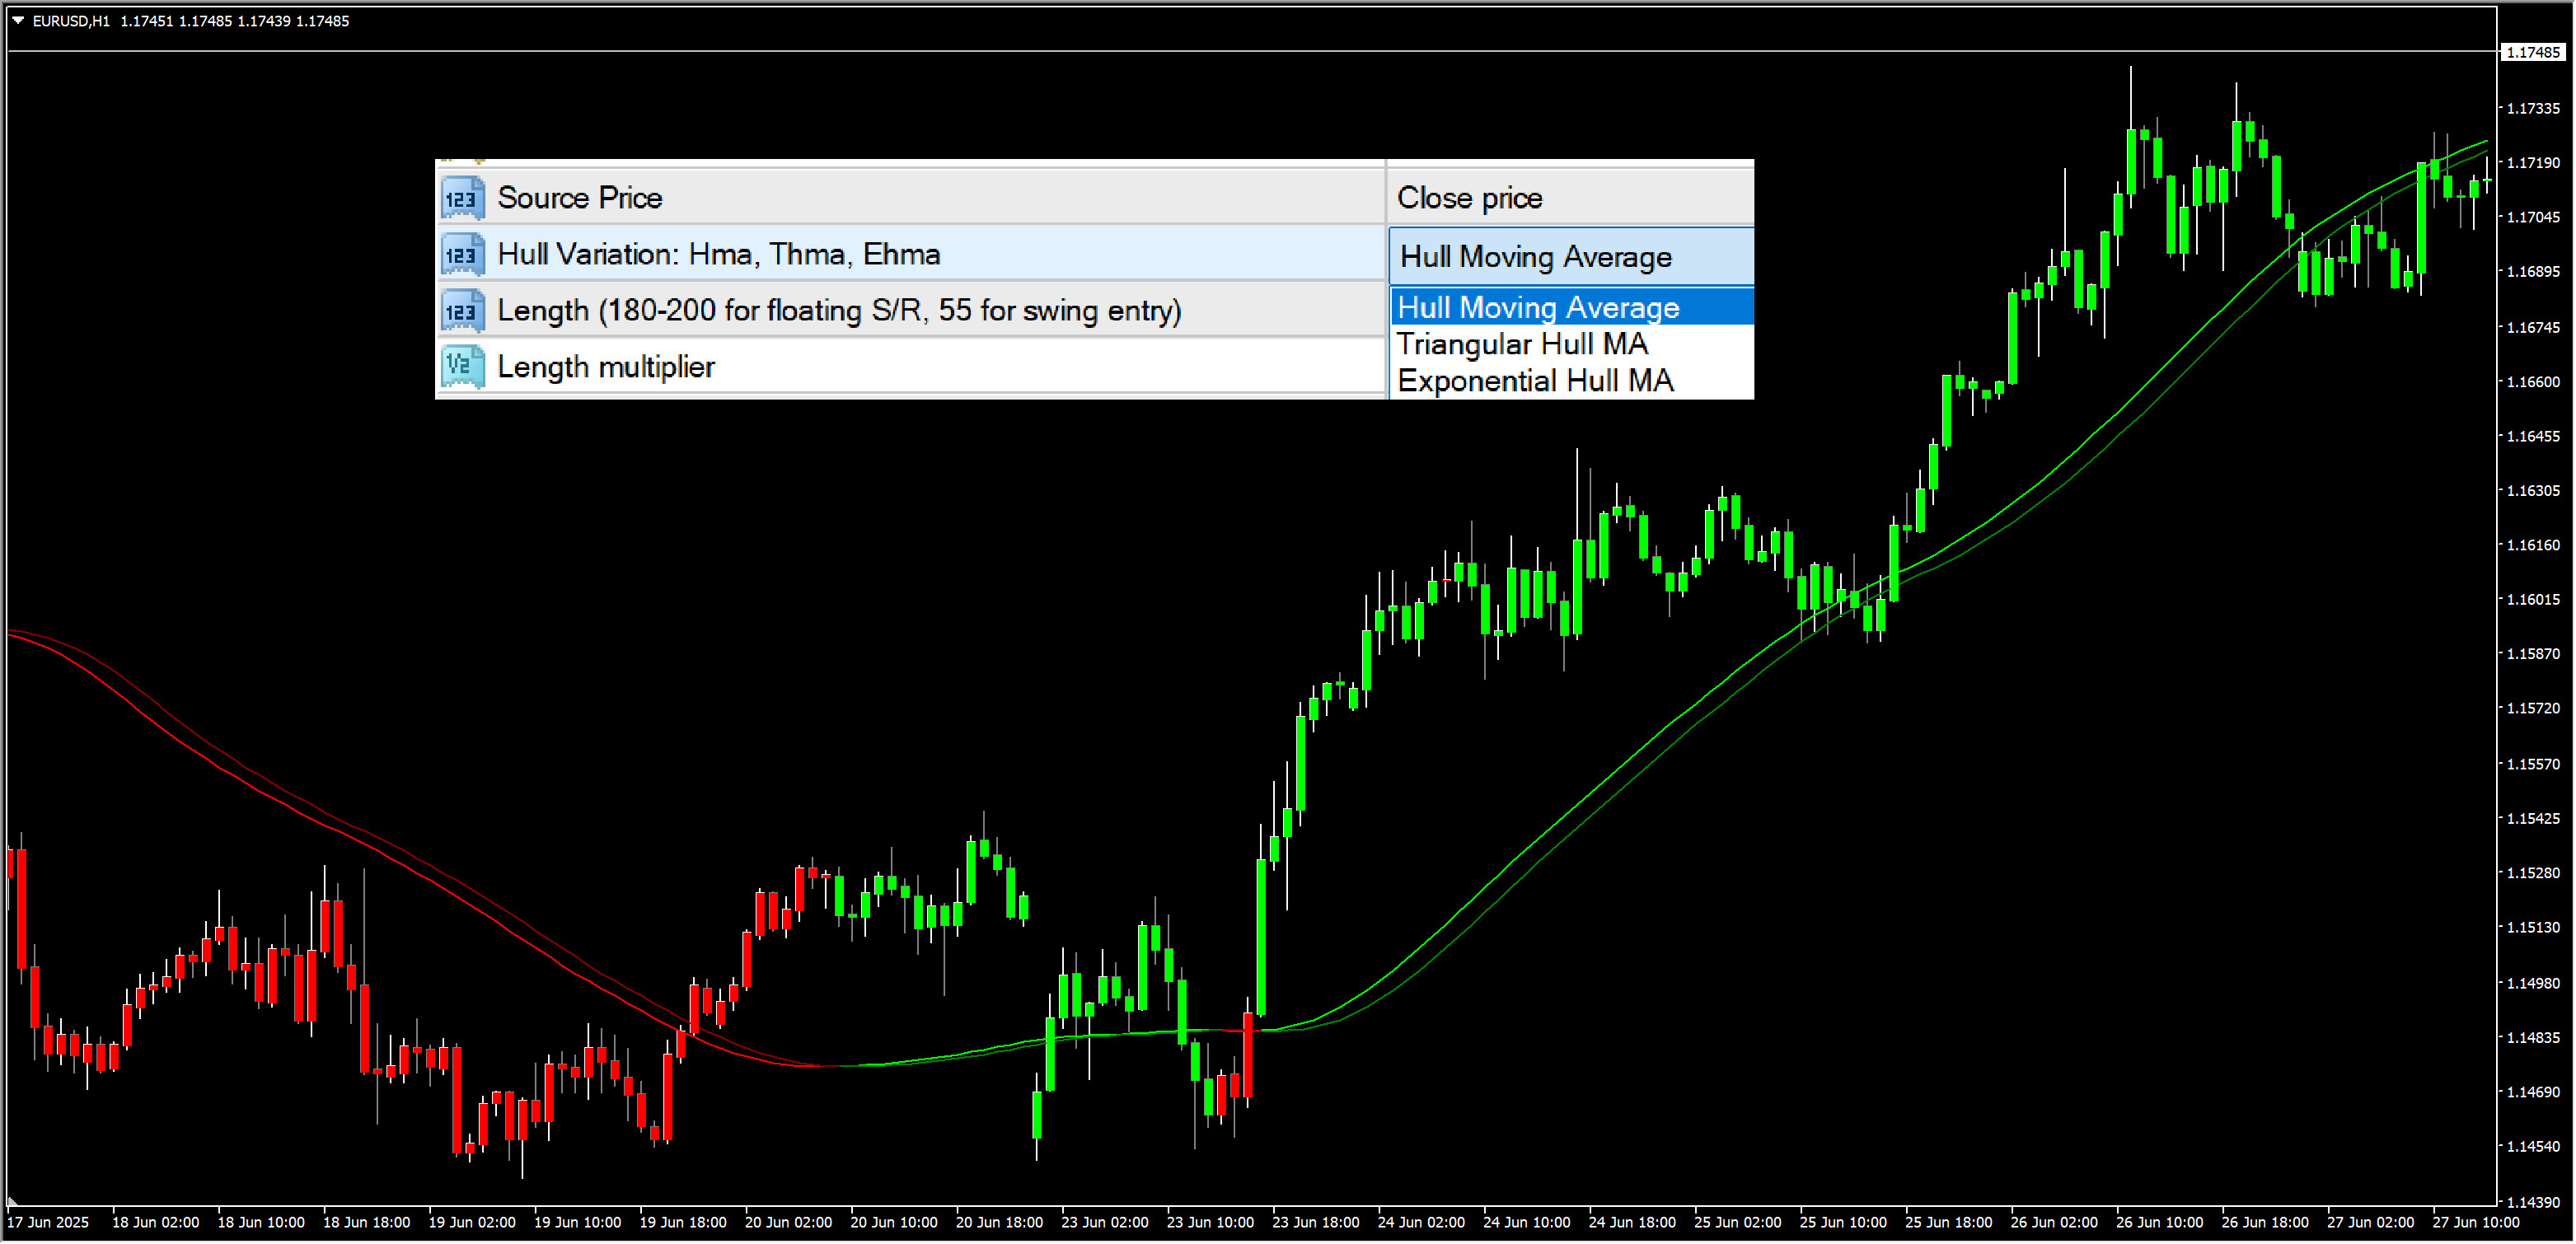
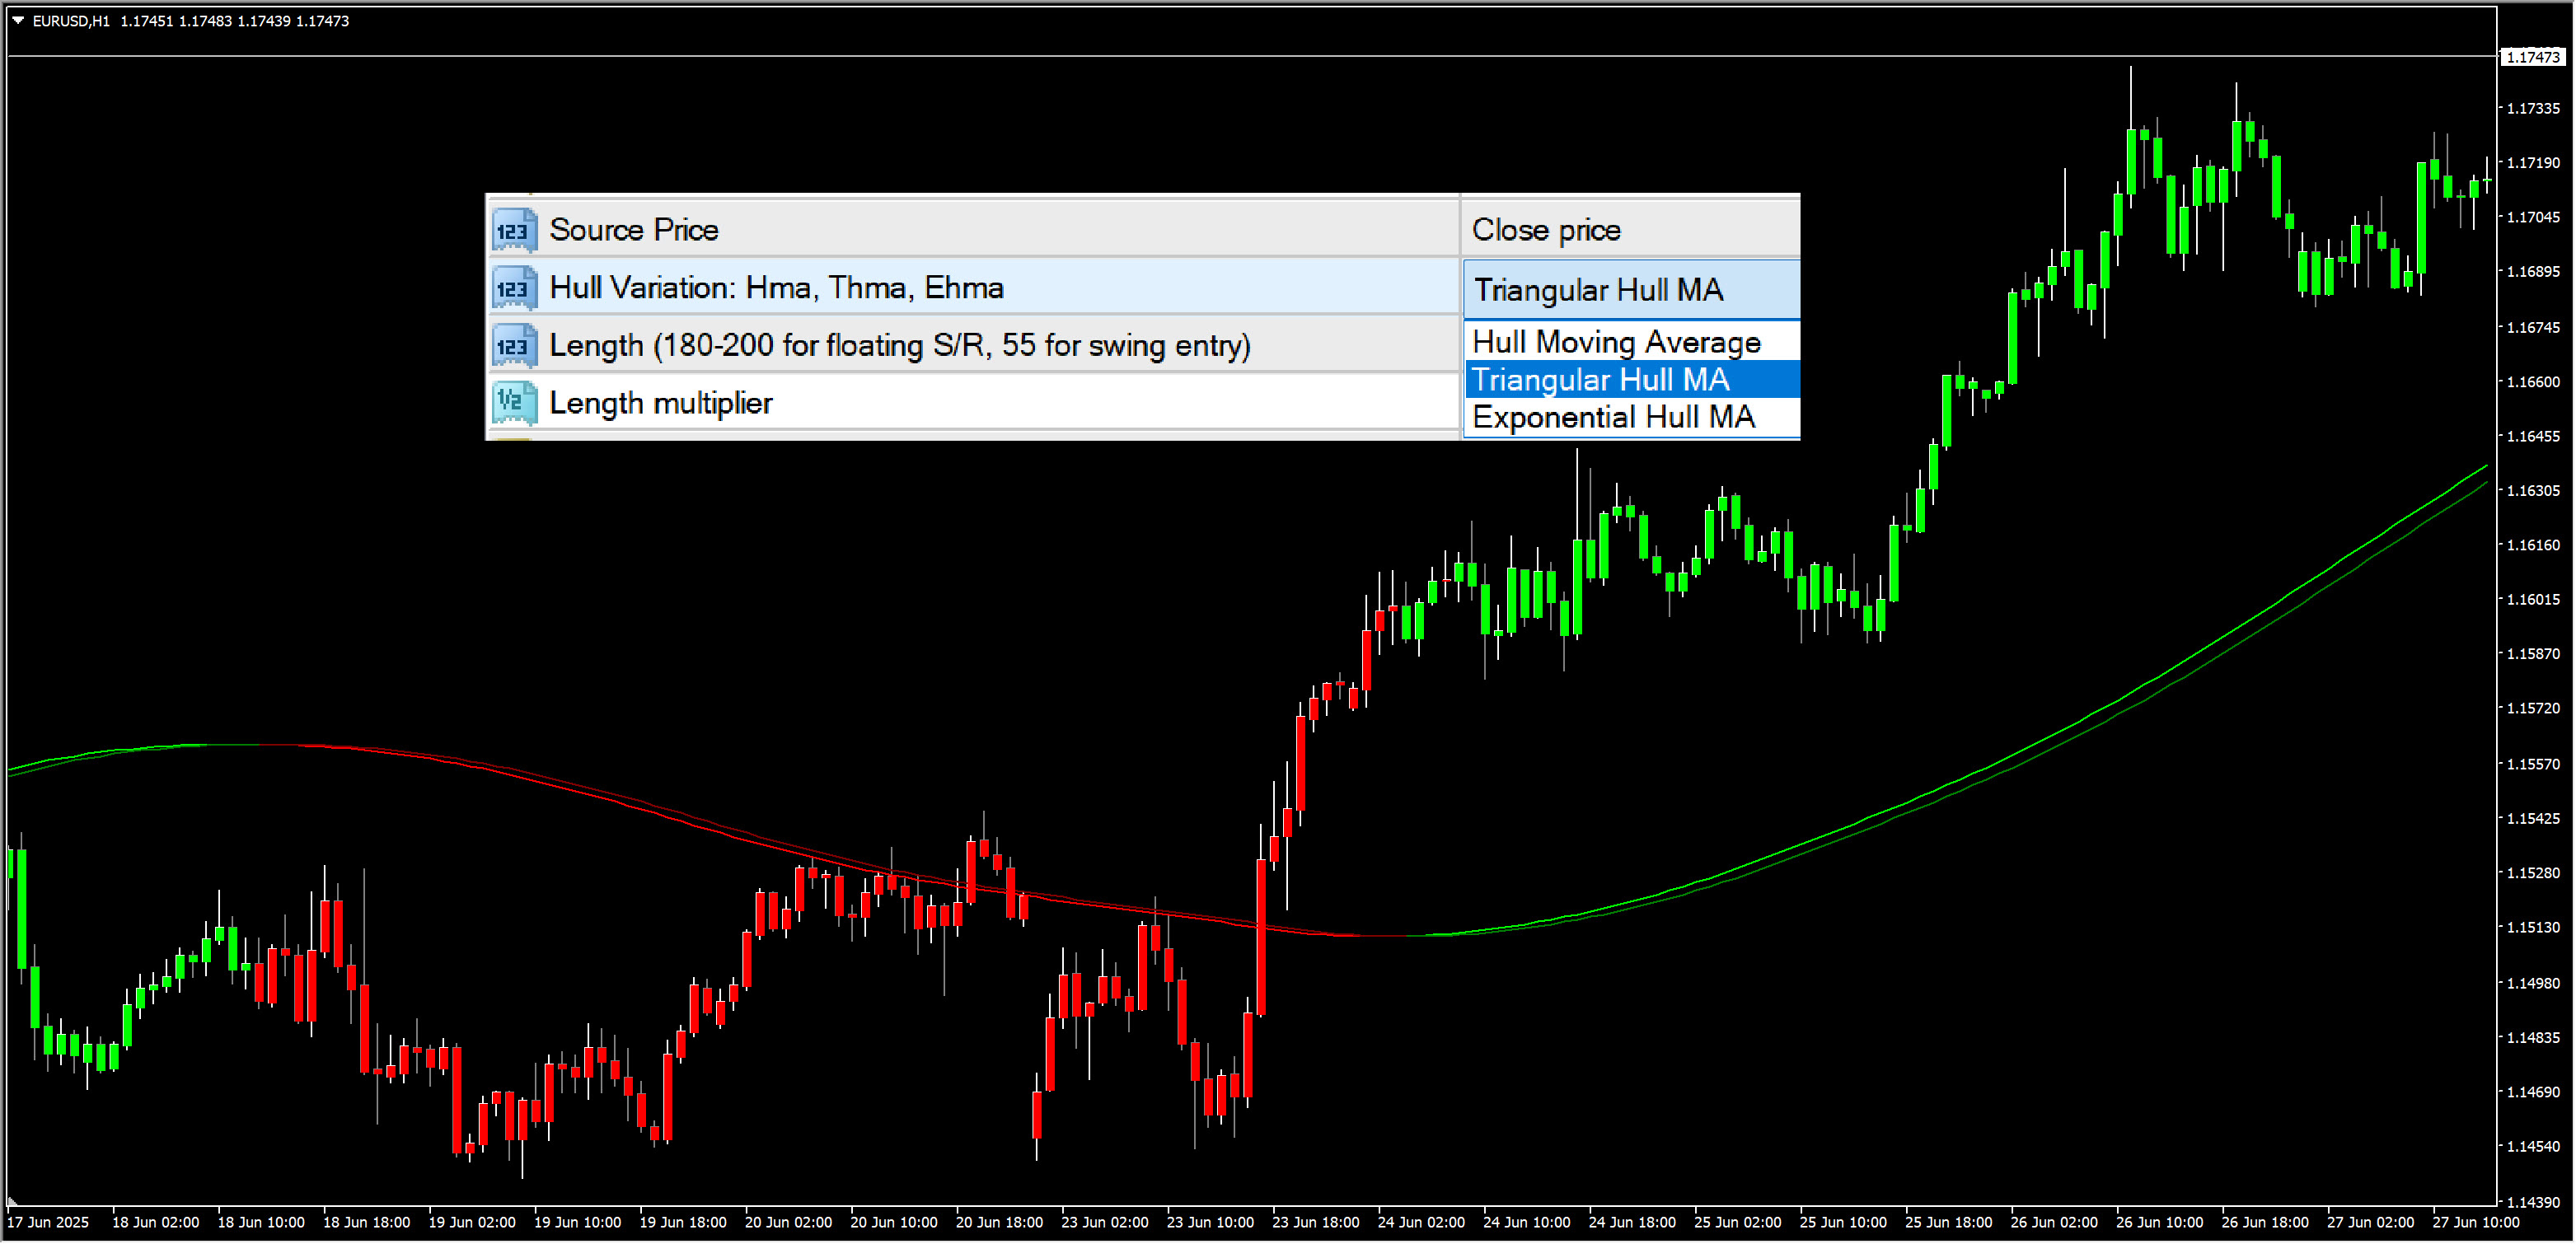
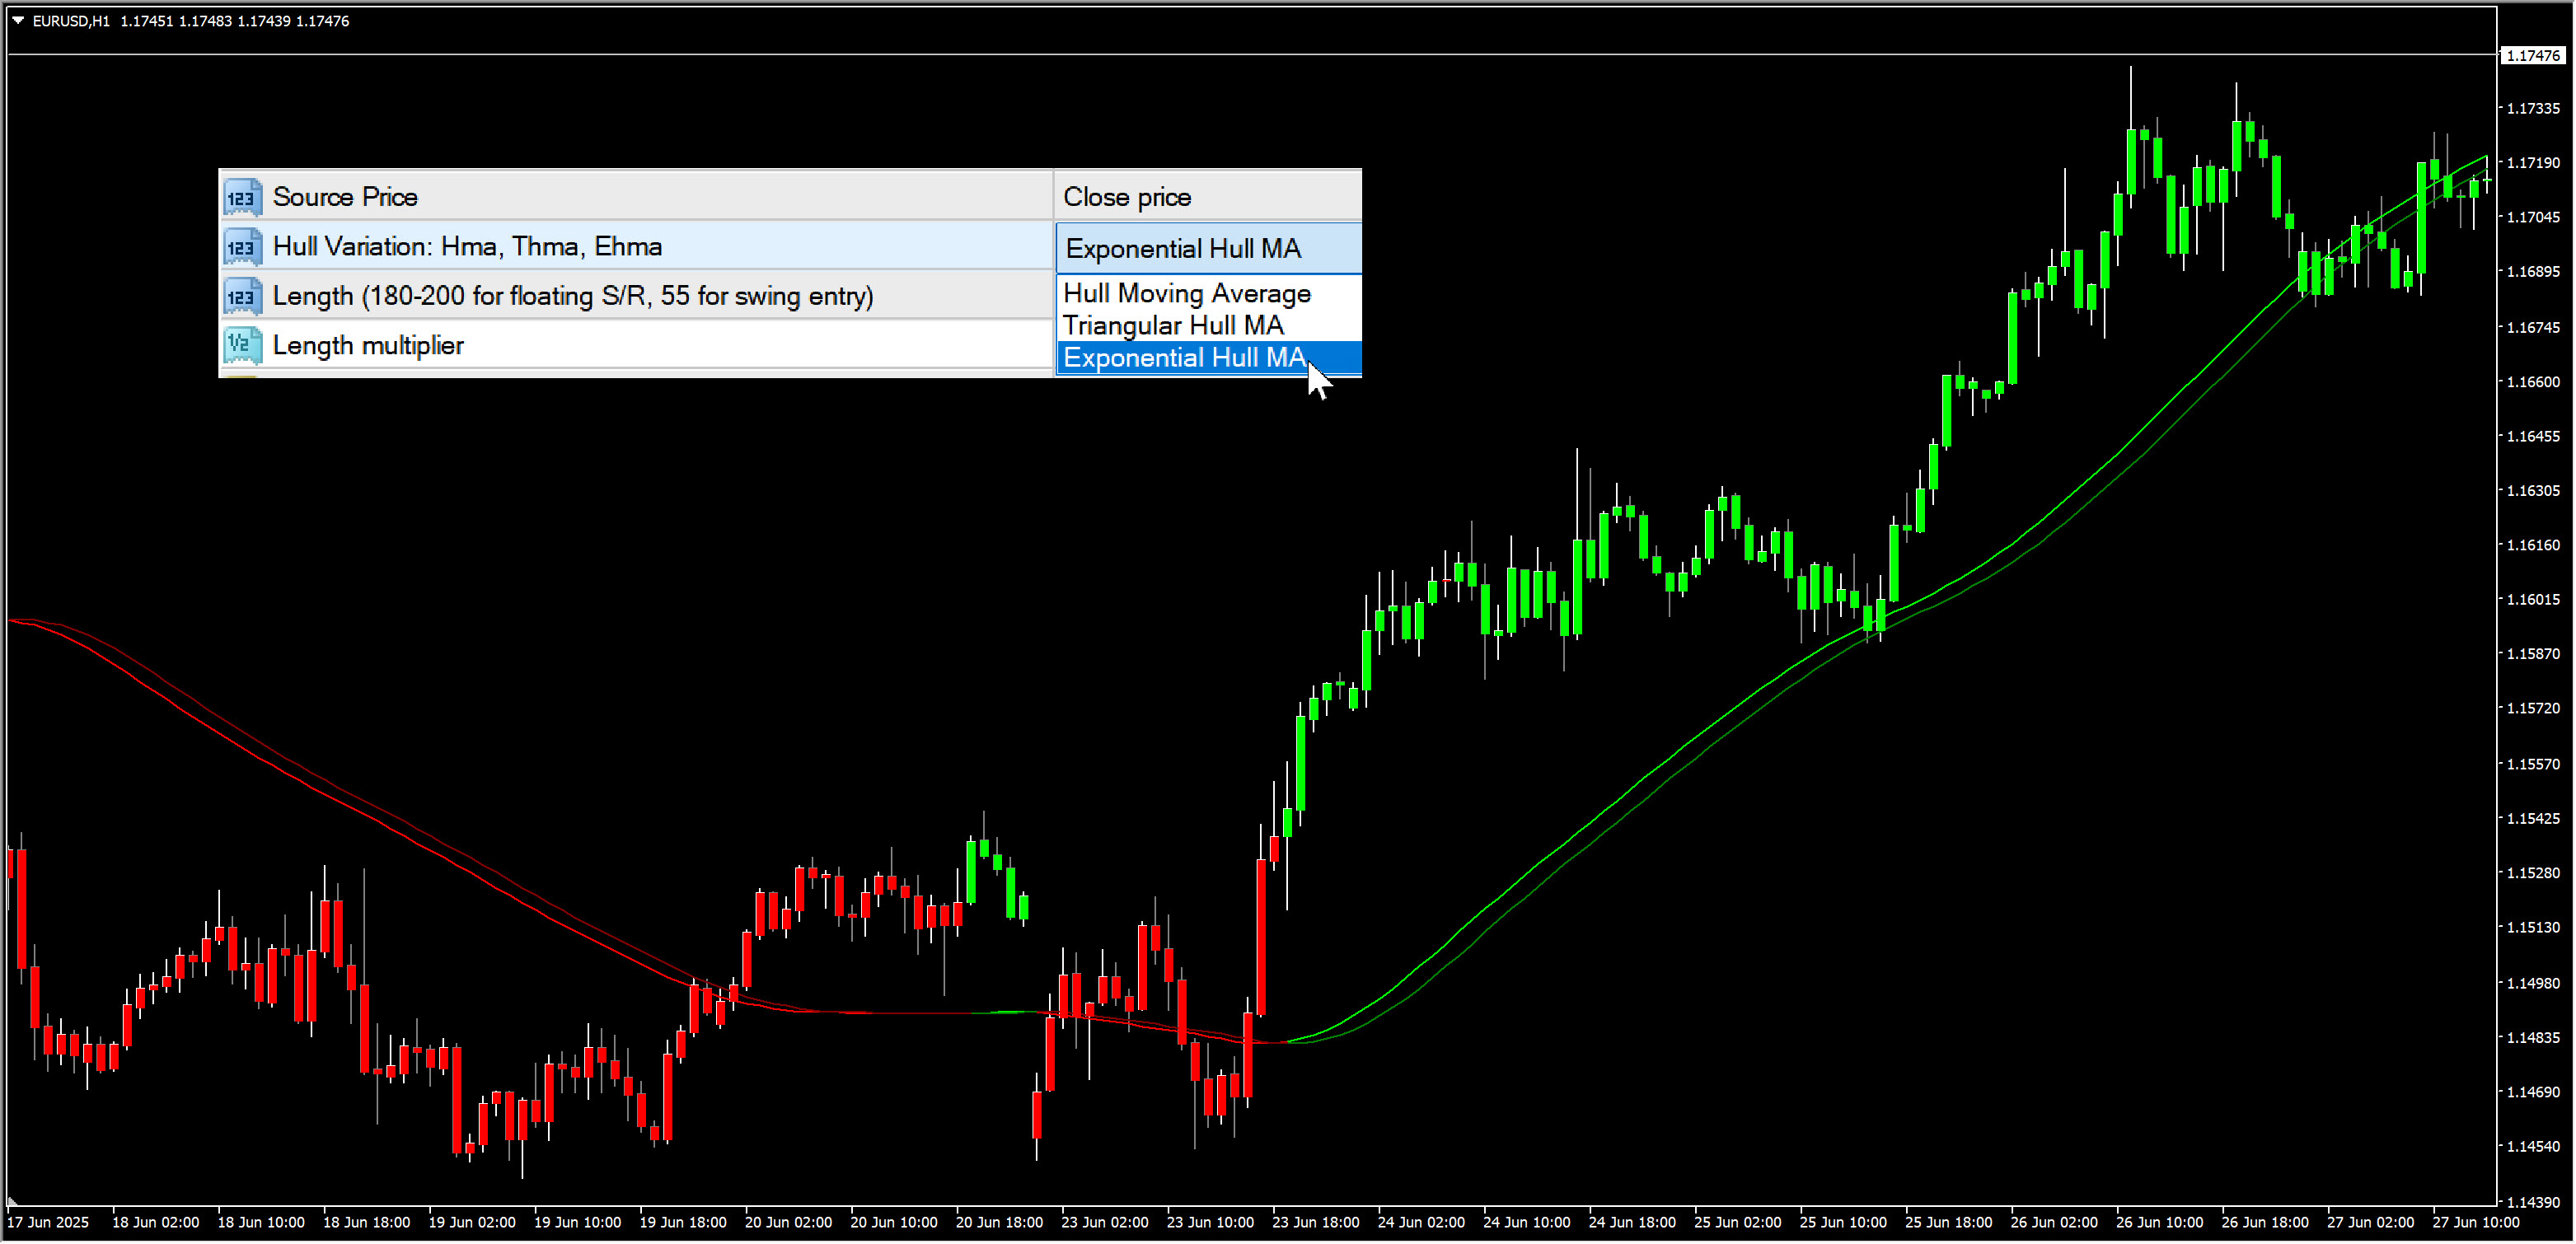
- Source Price: Choose which price (Close, High, Low, etc.) to calculate Hull MA from
- Hull Variation: Select between HMA, THMA, or EHMA
- Length: Period for Hull calculation (smaller like 55 for swing trading, 180-200 for support/resistance)
- Length Multiplier: Multiply the base length for longer-term analysis
Visual Settings
- Color Hull: Enable/disable automatic color switching based on trend
- Color Candles: Choose candle coloring mode (None, Trend-based, Above/Below Hull)
- Show as Band: Display both main and shifted Hull lines for band analysis
- Line Width: Adjust thickness of Hull lines
- Colors: Customize bullish, bearish, and neutral colors
Alert Settings
- Alert on Trend Change: Get notified when Hull trend switches
- Alert on Candle Switch: Get alerted when candle colors change
Example Trading Strategies
Strategy 1: Longer term H1
Add Wyatt's Pivots for Weekly if using H1. Or Pivots-H4 if TF is M1. Pivot-Daily if TF is M5-M15.
Wait for a high volume candle from VolumeCandles to cross a Pivot level.
Use default HMA 60 period and 3 multiplier. And only trade if in direction of Hull MA trend.
Strategy 2: M5 for quick scalping
Hull MA: Settings are Length is 60, and Length Multiplier is 3.
QQE Blue for Buy and Red for SELL.
Volume Oscillator: Above 0%
Waddah Attar Explosion above explosion line
Simple RSI: Not above Overbought(70) for Buy. And Not below oversold (30) for SELL.


 & AMD Framework")
")