
As reported today by the International Energy Agency (IEA), the world oil supply in July increased by 520,000 barrels a day, even despite the arrangements in OPEC. Growth in the supply of oil has been observed for 3 consecutive months. The supply of oil in the world increased in July to 98.16 million barrels per day, which is by 500,000 barrels per day more than in the same period last year. OPEC oil production in July increased by 230,000 barrels per day and reached 32.84 million barrels per day, the high of 2017. The increase in OPEC production of the cartel is primarily due to the increase in production in Libya and Nigeria, which are exempt from participation in the transaction.
The investors' skepticism about the effectiveness of OPEC measures is maintained due to poor compliance with the agreements on the reduction of oil production. All this imposes a negative imprint on the dynamics of oil prices.
Prices fell on Thursday, despite the earlier data from the US Energy Ministry on oil reserves in the US (Wednesday 14:30 GMT). According to the report of the Energy Information Administration (EIA) of the United States, US oil inventories fell 6.451 million barrels last week, which was the sixth consecutive week.
Today we are waiting for the publication at 17:00 (GMT) of the report of the oilfield service company Baker Hughes on the number of active drilling platforms in the US, which is an important indicator of the activity of the oil sector of the US economy and significantly affects the quotes of oil prices.
The US successfully used the situation with a rise in prices against OPEC actions last year and increased production by 750,000 barrels a day to 9.3 million barrels per day, the highest since summer 2015. In fact, by the efforts of the US alone, more than a third of the reduced production was offset.
At the moment, there are 765 active drilling rigs in the USA. If the number of installations increases again, this will negatively affect oil prices.
*)An advanced fundamental analysis is available on the Tifia website at tifia.com/analytics
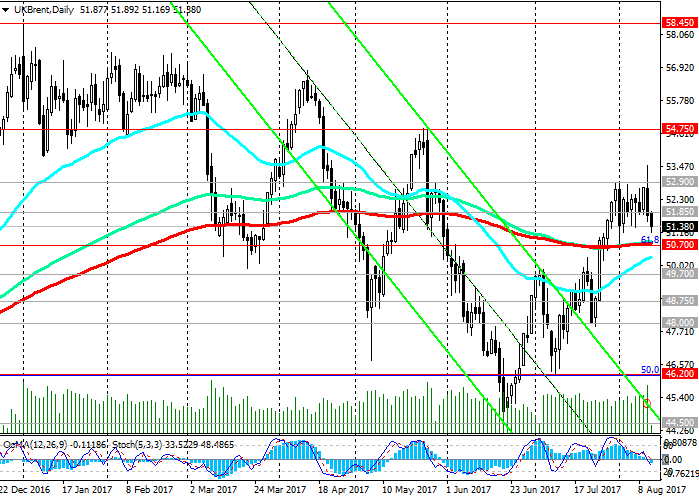
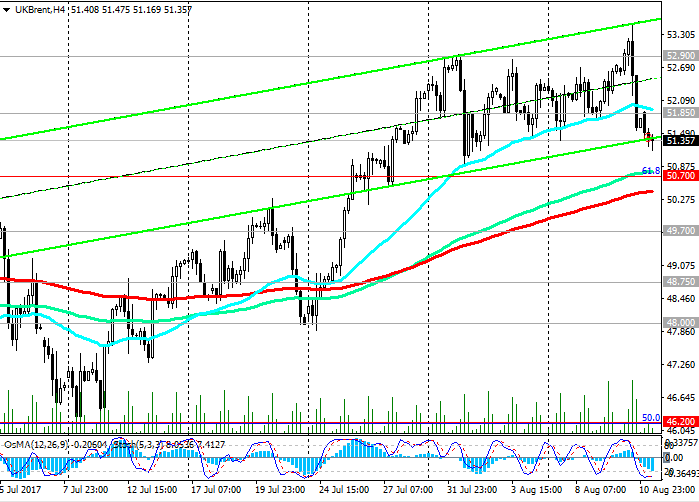
Support and resistance levels
The price of Brent crude oil was unable to develop an upward trend above the resistance level of 52.90 (EMA144 on the weekly chart) on Thursday and the second day is going down.
While the price is below the short-term resistance level of 51.85 (EMA200 on the 1-hour chart), the downside dynamics will increase, and the downside correction target will be the support level of 50.70 (EMA200, EMA144 on the daily chart, EMA50 on the weekly chart, as well as Fibonacci 61, 8% correction to the decline from the level of 65.30 from June 2015 to the absolute minimums of 2016 near the mark of 27.00).
Indicators OsMA and Stochastics on the 4-hour, daily charts went to the side of sellers.
If the price breaks through the key support level of 50.70, then the decline will accelerate, risking again moving into a bearish trend. The targets then will be support levels 49.70, 48.75, 48.00, 46.20 (50% Fibonacci level), 44.50 (lows of the year). The more distant goal is the level 41.70 (the Fibonacci level of 38.2% and the lower boundary of the descending channel on the weekly chart).
The scenario for growth implies breakdown of the resistance level of 52.90 and an increase to the resistance level of 54.75 (EMA200 on the weekly chart and May highs). The signal to growth will be the fixing of the price above the level of 51.85.
Support levels: 51.00, 50.70, 50.00, 49.70, 48.75, 48.00, 47.70, 46.20, 45.50, 44.50, 41.70
Resistance levels: 51.85, 52.90, 54.00, 54.75
Trading Scenarios
Sell Stop 51.10. Stop-Loss 52.10. Take-Profit 50.70, 50.00, 49.70, 48.75, 48.00, 46.20, 44.50
Buy Stop 52.10. Stop-Loss 51.10. Take-Profit 52.90, 54.00, 54.75
*) For up-to-date and detailed analytics and news on the forex market visit Tifia company website tifia.com


