

In anticipation of the publication of the monthly report on the US labor market, which will be released today at 12:30 (GMT), there is a sluggish dynamics in the financial markets. Today's data may be key to the dynamics of the dollar and US stock indices. It is expected that in July there were 180,000 new jobs in the non-agricultural sector of the economy (in June the increase was 222,000 seats).
Market attention will also be focused on data on wages in the US. It is expected that hourly wages in the US in July increased by 0.3% compared with June.
If the data on the labor market coincides with the forecast or will be better, the stock indexes will grow, despite the fact that the prospects for further tightening of monetary policy in the US remain.
Yesterday, very positive macro statistics on the United States were published. Production orders in June increased by 3.0% compared to the previous month. According to the report, the growth of new orders was the strongest in two years, which led to the fact that the rate of increase in employment was the strongest this year. The composite index of supply managers (PMI) in July rose to 54.6 against 53.9 in June.
Earlier in the week, ISM presented a report stating that "the conditions for doing business have improved, and new orders, production, employment, outstanding orders and exports increased in July compared to June."
The data presented confirm the stable trend of the recovery of the US economy, and this supports the bullish trend of the American stock market. US indices this year reached new highs supported by good company results and signs of recovery of world economic growth.
Today, the Dow Jones Industrial Average has risen to another record level of 22070.0, and its positive dynamics persists.
Nevertheless, at the time of today's publication of data from the US labor market, a surge in volatility is expected across the entire financial market, which must be taken into account when making trade decisions.
*)An advanced fundamental analysis is available on the Tifia website at tifia.com/analytics
Support and resistance levels
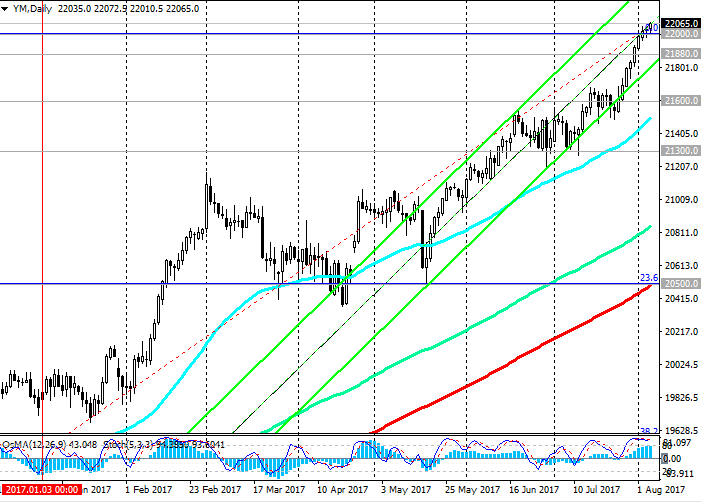
The DJIA index is developing the upward trend, being in a bullish trend since February 2016.
For the last 4 months of continuous growth, DJIA has grown by more than 6%, and today has updated the annual and absolute maximum, having risen to 22070.0.
Long positions are still relevant. Only in case of breakdown of the short-term support level of 21880.0 (EMA200 on the 1-hour chart) can we again return to consideration of short positions with the aim near the levels 20600.0, 21300.0 (July lows).
And only in case of breakdown of the support level of 20500.0 (the Fibonacci level of 23.6% of the correction to the growth in the wave from the level of 15660.0 after the recovery in February of this year to the collapse of the markets since the beginning of the year.The maximum of this wave and the Fibonacci 0% level is near the mark of 22000.0) We can talk about the breakdown of the bullish trend. Through the level 20500.0 also passes EMA200 on the daily chart. This level, therefore, is the key.
Support levels: 22000.0, 21880.0, 21600.0, 21300.0, 21000.0, 20500.0
Resistance levels: 22070.0, 22300.0

Trading Scenarios
Buy Stop 22080.0. Stop-Loss 21950.0. Take-Profit 22150.0, 22300.0
Sell Stop 21950.0. Stop-Loss 22080.0. Take-Profit 21880.0, 21600.0, 21300.0, 21000.0, 20500.0
*) For up-to-date and detailed analytics and news on the forex market visit Tifia company website tifia.com


")
![[XAUUSD]: Weekly Liquidity Activation Points (timings), June 22-26, 2026](https://c.mql5.com/6/1013/splash-preview-771790.png "[XAUUSD]: Weekly Liquidity Activation Points (timings), June 22-26, 2026")
")