

After the active growth and the achievement earlier this week of new one-month highs, the main US stock indexes suspended growth. The DJIA index is down for the fourth consecutive day, however, since the opening of today's trading day is trading in a narrow range near the mark of 21400.00. It seems that investors took a pause before the publication of fresh macro data on the US economy.
At 13:45 and 14:00 (GMT) will be published indexes of business activity in the manufacturing sector and services sector (PMI business activity from Markit Economics) in the US for June, as well as a report on the sale of new homes in the US in May . The PMI index is an important indicator of the business environment and the general state of the US economy. The indicator, exceeding the mark of 50, in general is a positive factor for US stock indices. The expected growth in indicators will support the dollar and stock indexes.
At 18:15 (GMT), the speech of FOMC member Jerome Powell will begin. From it, investors will want to hear information about the prospects for inflation and interest rates in the US. If Powell, like the other leaders of the Fed this week, speaks in favor of a softer scenario of raising rates in the US, this will support American indices.
American stock indexes rose on the basis of the current month, which ends next week. Macro statistics coming out across the US are generally quite positive to have a positive impact on US stock markets.
Their positive dynamics are still being preserved.
*)An advanced fundamental analysis is available on the Tifia website at tifia.com/analytics
Support and resistance levels
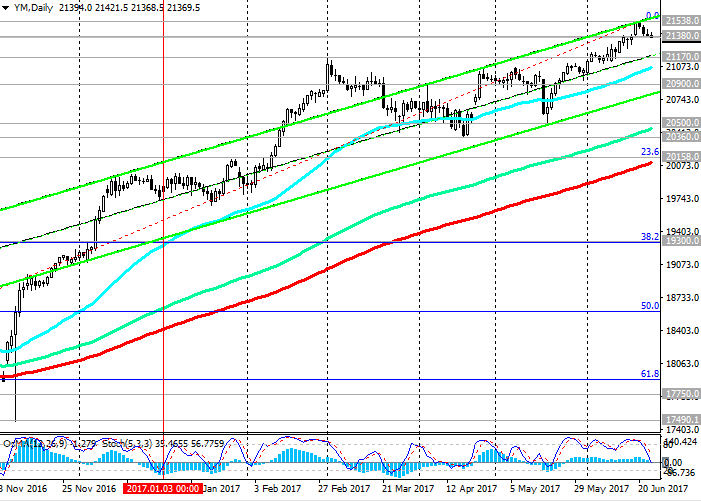
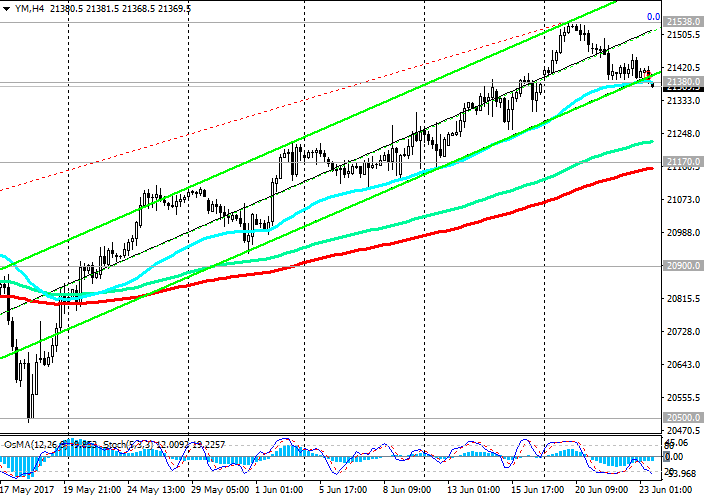
On Tuesday, DJIA exceeded its recent annual highs and reached a new absolute maximum near the mark of 21538.0. Nevertheless, subsequently the DJIA index decreased and today at the beginning of the European session is traded at the short-term support level of 21380.0 (EMA200 on the 1-hour chart, EMA50 on the 4-hour chart).
Here, the lower limit of the ascending channel passes on the 4-hour chart. The current level is quite strong, and about the arrival of today positive macro data from the US DJIA index can rebound from this level of 21380.0 and resume growth.
At the same time, the indicators OsMA and Stochastics on the 1-hour, 4-hour, daily charts turned to short positions, signaling a possible continuation of the downward correction. There may be a correction decrease to the level of 21117.0 (EMA200 on the 4-hour chart). Deeper correction movement is possible to the lower border of the ascending channel on the daily chart (level 20900.0).
If the downward trend is to increase, the decline in the index may continue to support levels of 20500.0 (the May lows and EMA144 on the daily chart), 20360.0, 20158.0 (EMA200 on the daily chart, December highs and Fibonacci level of 23.6% correction to wave growth from the level 15660.0 after the recovery in February this year to a collapse in the markets since the beginning of the year. The maximum of this wave and the Fibonacci level of 0% is near the mark of 21538.0).
The positive dynamics of the US stock market and DJIA index remains. Only in case of breakdown of the support level 20158.0 can we speak about the breakdown of the bullish trend.
Support levels: 21380.0, 21170.0, 20900.0, 20500.0, 20360.0, 20158.0, 19300.0
Resistance levels: 21538.0, 22000.0
Trading Scenarios
Buy Stop 21460.0. Stop-Loss 21310.0. Take-Profit 21538.0, 22000.0
Sell Stop 21310.0. Stop-Loss 21460.0. Take-Profit 21170.0, 20900.0, 20500.0, 20360.0, 20158.0
*) For up-to-date and detailed analytics and news on the forex market visit Tifia company website tifia.com


