

The US stock markets recovered completely after a sharp fall in the middle of last week, which arose amid growing political tensions in the US, which could become an obstacle to the implementation of President Donald Trump's program. However, strong corporate reports and positive fundamental macroeconomic indicators of the US helped keep the stock indices from a deeper fall. An additional positive factor for the US stock markets was yesterday the decline in political confrontation in the US after US President Donald Trump presented the draft budget for 4.1 trillion dollars. According to the budget, which provides for major changes in the social security system, the amount of US government spending in the next 10 years will be reduced by 4.5 trillion dollars. Tax cuts will also help increase economic growth. All together will help to cover the budget deficit, as it is supposed, for 10 years.
Yesterday's hearings in the US Congress, which did not reveal the links of President Donald Trump's campaign headquarters with Russia, also contributed to a reduction in domestic political tension in the United States.
The growth of shares of financial companies and oil and gas companies contributed to the increase in US stock indices for the fourth consecutive session. The Dow Jones Industrial Average rose 0.2% to 20937.00 points yesterday, the S & P500 rose 0.2% to 2398.00 points, Nasdaq Composite - by 0.1% to 6138.00 points.
Today investors are waiting for the release of the minutes of the May meeting of the Fed (18:00 GMT), which will look for hints on the timing of the next rate hikes and on plans to reduce the balance of 4.5 trillion dollars.
As the head of the Fed-Philadelphia Patrick Harker said yesterday, "raising rates in June is quite possible". He considers it appropriate to raise interest rates this year two more times.
In itself, an increase in the interest rate will not be able to break the bullish trend of the US stock market, despite the fact that the dollar will receive strong support. As the head of the Federal Reserve, Janet Yellen, stated more than once, "a rate hike speaks about the strength of the American economy".
From the US continue to receive positive macroeconomic data. Despite some deviation from the forecasted values in the smaller direction, in general, the indicators of inflation and the labor market of the USA point to the growth of the economy in the country. As long as the economy is growing, investors will prefer stocks and other asset-seekers shares and other high-risk risky instruments.
In general, the positive background for the main US stock indices remains.
Support and resistance levels
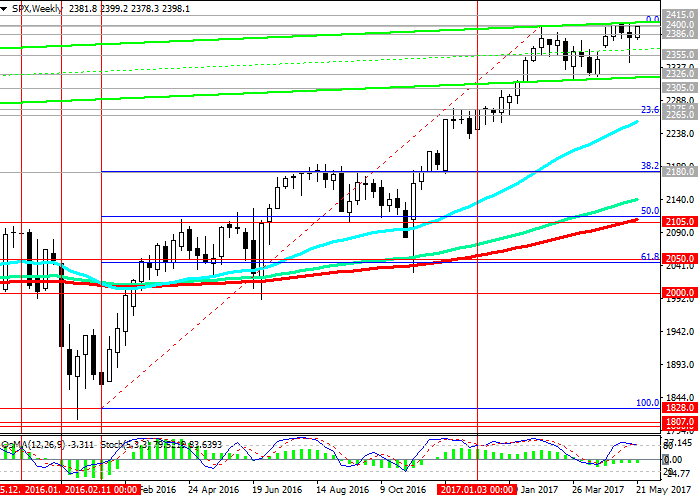
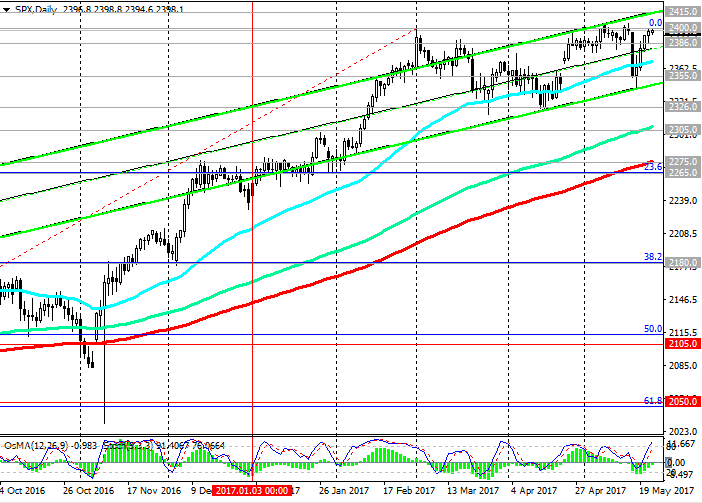
As a result of the four-day growth, the S & P500 index fully recovered losses suffered earlier amid renewed hype around the US president. With the opening of today's trading day, the S & P500 index is trading in a narrow range, pending the publication of the minutes from the May meeting of the Fed. The positive dynamics of the S & P500 index is preserved. Since February 2016, the S & P500 index has been growing steadily and is in the ascending channels on the daily and weekly charts.
At the moment, the S & P500 again tests the resistance level of 2400.0, reached in early March, for breakdown.
The indicators OsMA and Stochastics on the daily chart again turned to long positions. In case of resumption of growth, the nearest target will be level 2415.0 (the upper limit of the uplink on the daily chart).
The reverse scenario will be associated with breakdown of the short-term support level 2386.0 (EMA200 on the 1-hour chart) and a decrease with the nearest targets near the levels 2355.0 (bottom line of the uplink on the daily chart), 2326.0 (April lows). Only the breakdown of support levels of 2275.0 (EMA200 on the daily chart), 2265.0 (Fibonacci level of 23.6% correction to growth since February 2016) will cancel the bullish trend of the index.
Support levels: 2386.0, 2375.0, 2355.0, 2326.0, 2305.0, 2275.0, 2265.0
Resistance levels: 2400.0, 2415.0
Trading Scenarios
Sell Stop 2385.0. Stop-Loss 2405.0. Objectives 2375.0, 2355.0, 2326.0, 2275.0, 2265.0
Buy Stop 2405.0. Stop-Loss 2385.0. Objectives 2415.0, 2450.0, 2500.00
*) Actual and detailed analytics can be found on the Tifia website at tifia.com/analytics


