

The previous week, oil prices continued to rise. Optimism of investors was caused by media reports that Saudi Arabia and Russia are in favor of a 9-month extension of the agreement. Other OPEC member countries support the extension of the deal to reduce production for 9 months, said Saudi Arabia's oil minister Khaled Al-Falih. According to Al-Falih, the extension of the deal until March 2018 will allow OPEC to achieve its goal and reduce world reserves to an average of 5-year level, and restore the balance in the oil market. As is known, at the end of last year, 13 OPEC countries and 11 countries outside the cartel agreed on a total reduction of oil production by almost 1.8 million barrels a day until June.
However, this was not enough to restore the balance of supply and demand in the oil market. Other major oil-producing countries, such as the United States and Canada, have been actively increasing production, while the countries participating in the agreement have reduced production.
Last week, the International Energy Agency (IEA) published data according to which in the 1st quarter commercial oil reserves in developed countries increased by 24.1 million barrels. IEA data also indicate the growth of stocks in oil storage facilities and in April.
The US continues to increase oil production, which largely neutralizes the efforts of OPEC. So, according to the data provided by American oil service company Baker Hughes on Friday, the number of active oil drilling rigs in the United States again rose to 720 units in the previous week.
Some economists doubt that the OPEC deal will have the desired effect on the supply surplus. The increase in the number of drilling rigs and the increase in production in the United States go faster and larger than expected. This could lead to the fact that production in the US will continue to grow, and support from OPEC in 2018 will end. In this case, the risks of a sharp drop in oil prices rise significantly against the backdrop of a growing surplus of oil supply.
Nevertheless, the oil market is on the rise. The next OPEC meeting will be held on May 25 in Vienna, and much in the future dynamics of oil prices will depend on the decisions taken at this meeting. If it is indeed decided to extend the agreement for another 9 months, and also expressed the intention to continue to actively influence the balance of the oil market in the direction of reducing the level of oil supply, then oil prices will be a powerful incentive for further growth.
Support and resistance levels
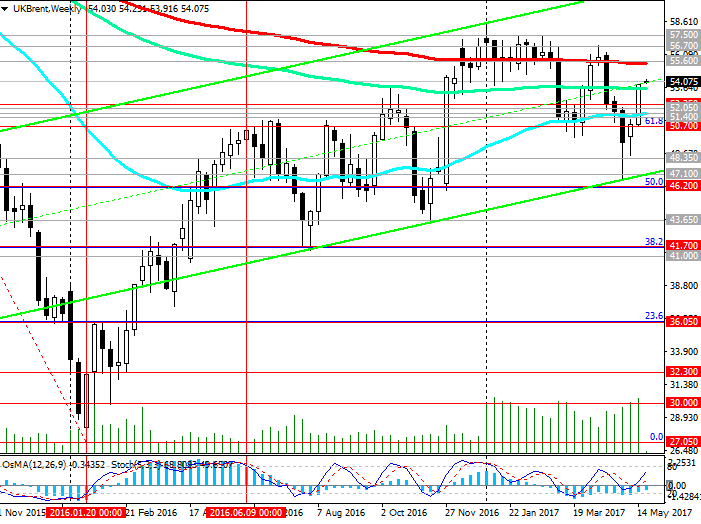
The previous week the price for Brent crude oil has significantly strengthened. The growth was almost 6%. The price has added 3 dollars per barrel, having risen to the level of 53.86 dollars.
Today's trading day began for oil with a small gap in price. However, in the future the momentum faded and the price for Brent crude at the beginning of the European session is close to the level of 54.00 (today's opening price).
Given that today the dollar is strengthening in the foreign exchange market, partially restoring its positions after a strong fall last week, it is also likely to reduce oil prices. Indicators OsMA and Stochastics on the 1-hour and 4-hour charts went to the side of sellers, signaling an overdue downward correction.
The price is on the upper border of the descending channel on the daily chart (level 54.00).
Withdrawal from this level will create prerequisites for further price reduction inside the channel to support levels of 52.35 (EMA144, EMA50 on the daily chart), 52.05, 51.70 (EMA200 on the daily chart). A stronger correction is possible to support level 50.70 (Fibonacci level 61.8% correction to decrease from 65.30 from June 2015 to absolute minimums of 2016 near the 27.00 mark).
If the support level breaks through 50.70, the price will go down to levels 48.35, 47.10, 46.20. In case of consolidation below level 46.20 (the Fibonacci level of 50% and the lower border of the descending channel on the daily chart), the upward trend in the price of Brent crude oil will be canceled.
The scenario for price growth is connected with the breakdown of the level of 54.00 and further strengthening to the levels of 55.60 (EMA200 on the weekly chart), 56.70 (April highs), 57.50, 58.40 (highs of the year).
On the daily and weekly charts, the OsMA and Stochastic indicators recommend long positions, and the price on the weekly chart is in the middle of the rising channel, the upper limit of which runs near the level of 62.00.
Support levels: 53.00, 52.35, 52.05, 51.70, 51.40, 50.70, 48.35, 47.00, 46.20
Resistance levels: 54.00, 55.60, 56.70, 57.50
Trading scenarios
Sell Stop 53.80. Stop-Loss 54.30. Take-Profit 53.00, 52.35, 52.05, 51.70, 51.40, 50.70
Buy Stop 54.30. Stop-Loss 53.80. Take-Profit 55.00, 55.60, 56.70, 57.00, 57.50
*) Actual and detailed analytics can be found on the Tifia website at tifia.com/analytics


