

After on Wednesday the US Energy Ministry presented data on commercial oil and petroleum products in the US for the previous week, oil prices rose sharply. Reserves in the US, contrary to forecasts, fell by 5.247 million barrels. This was the largest weekly decline this year. And the oil reserves in the US are declining for the fifth consecutive week.
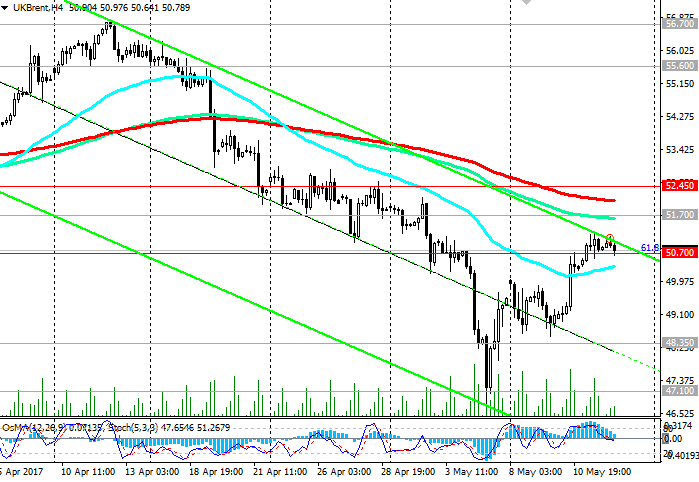
Yesterday, the price of Brent oil on the positive received an attempt to break through the resistance level at 50.70 (the Fibonacci level of 61.8% correction to the decline from the level of 65.30 from June 2015 to the absolute minimums of 2016 near the 27.00 mark). However, the attempt failed, and Brent crude oil traded today in a narrow range near the mark of 50.70 dollars per barrel.
The optimism of the participants in the oil market also increased after the OPEC report, which showed that members of the cartel adhere to the established quotas. As expected, OPEC should extend or agree on a stronger production cut on May 25. If such an agreement is reached, oil prices will receive strong support. It seems that oil futures will finish the week with a rise of more than 3%, if the overall positive picture again does not spoil the report from the American oil service company Baker Hughes, which will be published today closer to the end of the US trading session (18:00 GMT). The number of active oil drilling rigs in the US earlier rose again (by 6 units to 703 units). The next growth will negatively affect oil prices.
According to analysts of the oil market, the surplus of oil reserves in the world is still high. OPEC raised its forecast for growth in oil production outside the cartel in 2017 to 950,000 barrels per day. Accelerating production in the US, Brazil, Canada, as well as Nigeria and Libya, which are part of OPEC, largely alleviates OPEC's efforts to create an artificial deficit in the oil market and stabilize oil prices.
At the same time, OPEC understands that oil producers in the above countries take the market share from the cartel, which is narrowing due to a decrease in oil production, which occurs within the framework of the OPEC agreement.
If the agreement on limiting production is not extended (the OPEC meeting will be held on May 25), the oil market may again rapidly return to the lows of 2016, when the barrel of Brent crude oil was just above $ 27.00.
From the news for today, also waiting for data on inflation in the US. At 12:30 (GMT) will be published data on retail sales and consumer price indices for April, which are one of the main inflation indicators in the US. A high result will strengthen the US dollar, and vice versa, a low result will weaken the USD. The forecast: + 0.6% (against -0.2% in March) and + 0.3% (against -0.3% in March), respectively. Evidence of accelerating inflation will increase the likelihood of an increase in interest rates by the US Federal Reserve System.
In this case, the attractiveness of the dollar for investors will grow, while prices for oil and other commodities, denominated in US dollars, will fall.
Support and resistance levels
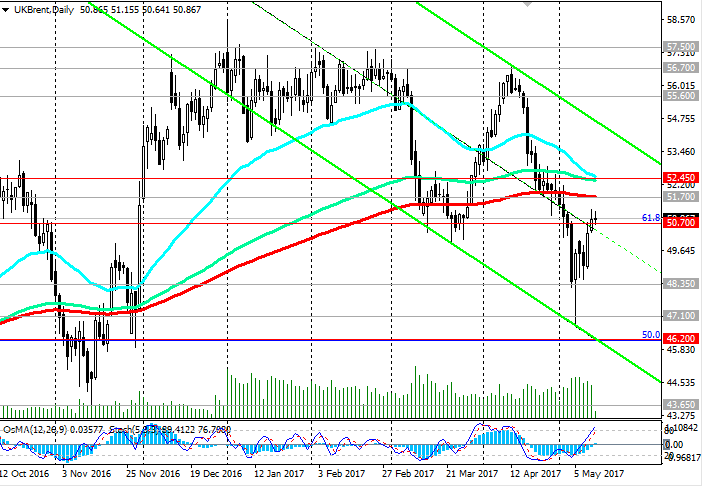
Since the middle of last month, the price of Brent crude oil has fallen sharply and has lost almost 12% to the current moment. The negative dynamics prevails while the price is below the levels 51.70 (EMA200 on the daily chart), 50.70 (Fibonacci level 61.8% correction to the decline from the level of 65.30 from June 2015 to the absolute minimums of 2016 near the 27.00 mark).
On the daily chart, a downward channel formed, the lower boundary of which passes near the support level of 46.20 (50% Fibonacci level).
In the event of a breakout of the level of 50.70, the price that is currently at this level will rush down to levels 48.35, 47.10, 46.20. In the case of consolidation below 46.20 (50% Fibonacci level), the upward trend in the price of Brent crude oil will be canceled.
An alternative scenario for growth is associated with a return of the price above the level of 52.45 (EMA144 on the daily chart). So far, negative dynamics prevails.
Support levels: 50.70, 48.35, 47.00, 46.20
Resistance levels: 51.70, 52.45
Trading scenarios
Sell Stop 50.50. Stop-Loss 51.25. Take-Profit 50.00, 48.35, 48.00, 47.10, 46.20
Buy Stop 51.25. Stop-Loss 50.50. Take-Profit 51.70, 52.45, 55.60, 56.70, 57.00, 57.50
*) Actual and detailed analytics can be found on the Tifia website at tifia.com/analytics


![[Two Different Approaches to Market Timing]: The Spiral Calendar and the VISTmany Research Project](https://c.mql5.com/6/1012/splash-preview-771691.png "[Two Different Approaches to Market Timing]: The Spiral Calendar and the VISTmany Research Project")
