
NZD/USD: the pair’s dynamics depends on the dynamics of the US dollar

Trading recommendations
Sell in the market. Stop-Loss 0.7225. Take-Profit: 0.7185, 0.7090, 0.7000, 0.6975, 0.6940, 0.6900, 0.6860
Buy Stop 0.7225. Stop-Loss 0.7185. Take-Profit 0.7240, 0.7340, 0.7375
 Overview and Dynamics
Released today at the beginning of the Asian session (less than expected) data on retail sales in New Zealand for the 4th quarter, provoked a decline in the New Zealand currency.
The volume of retail sales increased by 0.8% in Q4 (forecast was 1.1%). The Central Bank of New Zealand in his last statement pointed out those low interest rates will persist for a long time. Despite the fact that for the first time in the last few years, annual inflation returned to the target range of 1% -3%, the RBNZ is concerned about the slow pace of economic growth. So, the index of business activity in the manufacturing sector (PMI) of New Zealand, also published today, which evaluates conditions in the business environment of the country, came out in February with a value of 51.6 (lower than the previous month's 54.5). However, actively growing in recent years, housing prices in New Zealand will constrain the central bank from easing monetary policy to avoid overheating of the housing market. Thus, the dynamics of the pair NZD / USD to a large extent will depend on the dynamics of the US dollar.
US Dollar declines in recent years in the foreign exchange market against the backdrop of uncertainty Donald Trump's plans for economic policy, and there is uncertainty about whether strong or weak US dollar is needed. Purchases of safer asset (US government bonds) causing a decline in their yields and the weakening of the US dollar.
Donald Trump said earlier that the country needs a cheaper dollar. However, judging by the statements of representatives of the Federal Reserve, the regulator focused on the imminent increase in interest rates, which is supporting the US dollar. In the very same Fed declare the independence of their policies by the US President, and strong US macroeconomic indicators give grounds for a gradual tightening of monetary policy in the country.
Thus, the different direction of monetary policy in the United States and New Zealand reduces pair NZD/USD.
Technical analysis
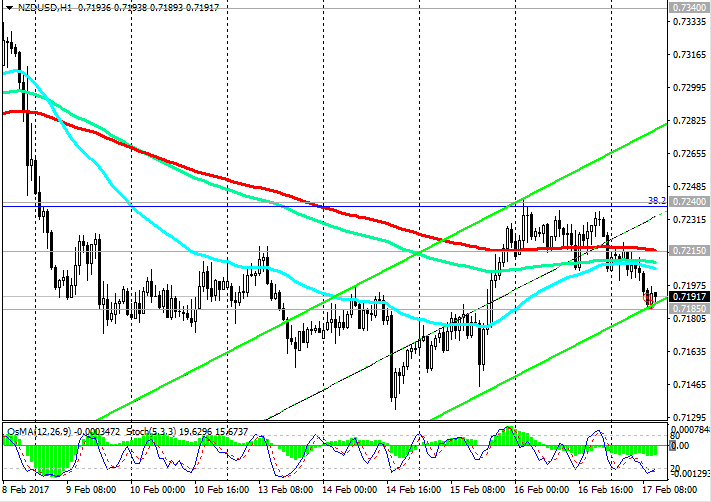
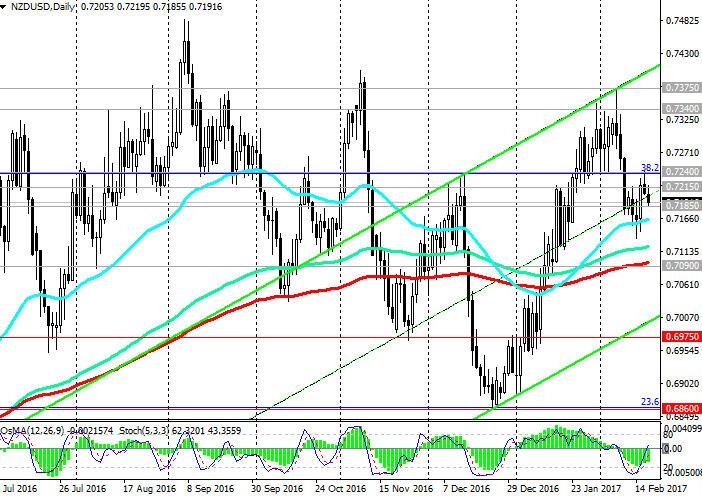
The pair NZD / USD has failed to develop an upward movement above the level of 0.7240 (EMA144 on the weekly chart and Fibonacci level of 38.2% upward correction to the global wave of decrease in pair with the level of 0.8800, which began in July 2014). At the beginning of the European session, NZD / USD pair is trading near the support level of 0.7185 (EMA200 on 4-hour chart). This trend line, (the level of 0.7215), defined declining 200-period moving average on the 1-hour chart, is broken down. OsMA and Stochastic indicators on the 1-hour chart also signal to sell pair NZD / USD.
On the 4-hour chart has formed a new downstream channel. Break of the support level of 0.7185 will give a new impetus to reduce the pair NZD / USD.
The objective of reducing the level of support would be 0.7090 (EMA200 on the daily chart). Nevertheless, the pair NZD / USD is in a rising channel on the daily and weekly charts. Positive dynamics of the pair NZD/USD is retained, while the pair is above the support level of 0.7090. Sales are relevant in the short term in the range between the levels of 0.7240, 0.7090.
The breakdown in one direction or another will determine the direction of further movement of the pair NZD / USD.
In the case of the breakdown level of 0.7090 the pair NZD / USD may fall to support levels 0.6975 (November lows), 0.6860 (23.6% Fibonacci level) that may reverse the uptrend the pair NZD / USD, which began in September 2016.
The reverse scenario involves fixing above resistance level 0.7240 and the rise in the uplink on the weekly chart, the upper limit of which lies above the resistance level 0.7550 (50% Fibonacci level) near the level of 0.7700. The immediate purpose of the same in the case of growth of the pair will be 0.7340 resistance level (EMA200 on the weekly chart).
Support levels: 0.7185, 0.7090, 0.7000, 0.6975, 0.6940, 0.6900, 0.6860
Resistance levels: 0.7240, 0.7340, 0.7375
Author signals - https://www.mql5.com/en/signals/author/edayprofit
*)presented material expresses the personal views of the author and is not a direct guide to conduct trading operations.


