

Crude Oil Price Forecast: Early 2017 Volatility Pattern Arises
Talking Points:
- Crude Oil Technical Strategy: rising wedge should alert bulls
- Watch for move to and possibly through key support on early-2017 pull backs
- Crude inventory gains on DoE data opens up focus on delivered OPEC cuts
A core observation of the current state of the Oil market is that short sellers have been nearly wiped out as we trade near 17-months highs and aggressively bullish options have risen. Naturally, the development of the OPEC and non-OPEC production cut accord in late November through mid-December was critical through this. However, we’re now a week away when the production cuts are going to be verified as they are set to go into effect in the New Year. We recently argued that Saudi’s hand may have been forced to cut due to capacity issues that were made aware in a Reuters report.
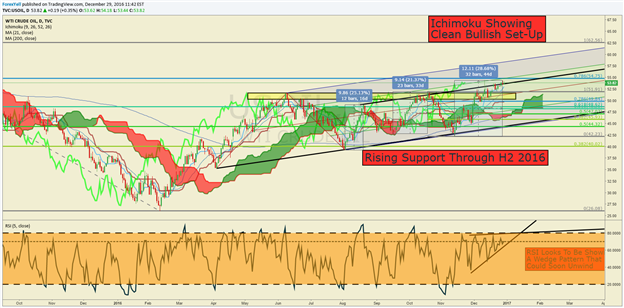
We are now trading at the top of a channel drawn with the same slope as the support that we had been focusing on throughout the 2016 rebound and into 2017 (rising trendline in black on the chart above) drawn from the first higher low off the rebound from the February low. While we remain Bullish due to fundamental and technical factors, there is a rising wedge pattern developing that should warrant attention.
The rising wedge pattern has developed on the recent break into 17-month highs. Per the Daily Sentiment Index as of Wednesday’s close, the Crude market is composed of 75% Bulls, which remains well short of the 85% extreme Bullish sentiment reading that could mean there is a good deal more room to run in the market as 2017 gets underway. However, if the production cuts do not come to pass, it’s possible that the rising wedge could bring about a sharpsell-off that retraces (likely not all) of the recent 28% rally from the mid-November low.
The wedge pattern is also developing on the RSI(5) below the price on the chart below. A breakdown in RSI(5) over five periods would be indicative of average losses outpacing average gains over the past 5-periods that would likely make way for a sharp retracement that aligns with the price pattern on the chart.
Join Tyler Monday’s at 3 pm EST to discuss key global macro trends like Oil (Free Registration)
A worthwhile lesson to be shared is that there are two types of rising diagonals. Reversal often come after ending diagonals whereas sharp trend advancements develop after leading diagonals. Naturally, it’s difficult to tell which is which beforehand and misinterpreting a leading diagonal as an ending diagonal has been a costly mistake and one that changed how I manage risk when trading.
If we are seeing an ending diagonal, a reversal should develop in the price of Crude Oil, and we’d be on the watch for the price to test the prior resistance pivot range (50/51 per barrel). A break down through the pivot zone would open up focus on the rising support that lies between $47/45. Only a break below this zone would take us from Bullish to Neutral. Until then, we’ll favor eventual upside heading into 2017.
Conversely, a leading diagonal would open up the 2015 high of $62.56. Should price fail to break the $50/51 support zone (highlighted yellow rectangle), we’ll expect an eventual move to the 2015 high in early 2017. Ichimoku also favors a Bullish continuation move.
D1Crude Oil Price Chart: USOIL Sticks Near $51/Bbl. After Extending Further From Prior Channel
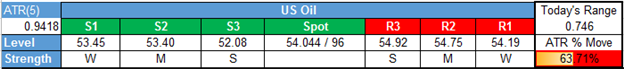
Key Levels Over the Next 48-hrs of Trading as of Wednesday, December 29, 2016


")
![[iVISTscalp5]: TSI — Timing Strength Index](https://c.mql5.com/6/1015/splash-preview-772243.png "[iVISTscalp5]: TSI — Timing Strength Index")
![[XAUUSD]: Weekly Liquidity Activation Points (LAP), July 6 - July 10, 2026](https://c.mql5.com/6/1015/splash-preview-772241.png "[XAUUSD]: Weekly Liquidity Activation Points (LAP), July 6 - July 10, 2026")