

Trading recommendations
Sell in the market. Stop-Loss 0.7710. Take-Profit 0.7595, 0.7530, 0.7490, 0.7445, 0.7325, 0.7290, 0.7200
Buy Stop 0.7710. Stop-Loss 0.7670. Take-Profit 0.7730, 0.7800, 0.7820, 0.7900
Technical analysis
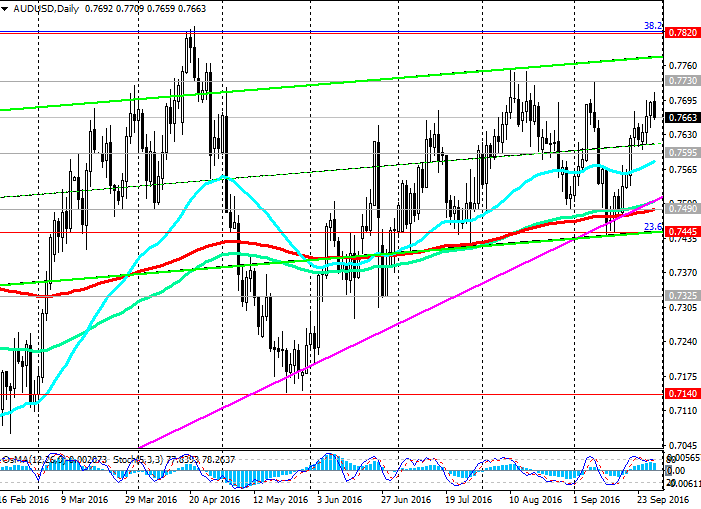
Early last week, the AUD / USD rebounded from important support level 0.7490 (EMA50 on the weekly chart, EMA200 on the daily chart and the lower line of the rising tapered triangle).
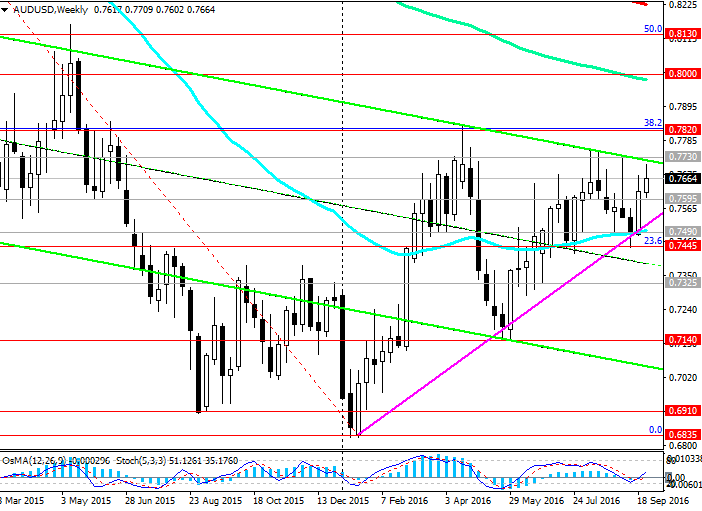
At yesterday's rise in oil prices AUD / USD pair again rose to the top of the range, it is not short of about 40 points. However, today there is profit in long positions in oil and commodity currencies, including the pair AUD / USD. September the pair AUD / USD held within a range between the levels of 0.7445 (Fibonacci level of 23.6% correction to the wave of decrease in pair in July 2014) and 0.7730 (highs in August, September, and the upper line of the descending channel on the weekly chart). A level of 0.7730 is as the upper limit of the converging ascending triangle.
It appears that the range of 0.7445 - 0.7730 remains topical for the pair AUD / USD. Based on the rules of trade in the range, it is recommended to open short positions near the upper limit of the range, in this case, the level of 0.7730, with stops above this limit by 20-30 points. Also, please note that through 0.7730 mark the upper limit of the converging triangle. The likelihood is of a rebound, and the breakdown of the border. Thus, the level of 0.7730 is the key in month time span.
Indicators OsMA and Stochastic on the 4-hour chart have moved to the side of the sellers. On the daily chart indicators are starting to turn around for a short position.
The upward tapering triangle is a continuation of the trend. Break its upper boundary at 0.7730 level could create conditions for the further growth of the pair AUD / USD. In case of breaking the resistance level 0.7820 (38.2% Fibonacci level of the correction to the wave of decrease in pair in July 2014, the April highs), the pair AUD / USD is heading to 0.8000 levels (EMA144 on the weekly chart), 0.8130 (50.0% Fibonacci level ), 0.8200 (EMA200 on the weekly chart).
Reverse the scenario associated with the breakdown of the support level 0.7445 (23.6% Fibonacci level). In this case, a negative trend can prevail, and the goals of further reducing the pair AUD / USD may be levels 0.7325, 0.7140 (May lows).
Support levels: 0.7595, 0.7530, 0.7490, 0.7445, 0.7325, 0.7290, 0.7200, 0.7140
Resistance levels: 0.7730, 0.7820, 0.7900, 0.8000
Overview and Dynamics
Yesterday's sharp rise in oil prices also triggered the growth of quotations of commodity currencies, particularly the Canadian and Australian dollars. Both currencies are sensitive to oil quotations due to the fact that the oil and gas sector of these economies is a major. The recent weakening of the US dollar on uncertainty about the prospects for higher interest rates in the US also caused a strengthening of the price of other commodities, including agricultural products and mining complex in Australia, which is also essential for the economy of this country. Iron ore, as well as liquefied natural gas, is one of the main export products, despite the fact that the Australian government over the last few years trying to reorient the economy of the country, developing, building, tourist, educational sectors.
Today oil prices are falling, dragging, and the Australian dollar. The AUD/USD declines in late Asian and European session opening.
In contrast to the decrease in oil prices and the Australian dollar performs ongoing uncertainty about the likelihood of interest rate rises in the US by the end of the year. At the last meeting on September 20-21, the Fed kept US interest rates at 0.5%. And, although hinted, they say that there is now a strong case for a rate hike before the end of the year, investors' expectations regarding the extent of a possible rise in interest rates over the next year due to weak fundamental changes in the global economy. And the mixed US macroeconomic indicators themselves back down the terms of the next rate hike. Many investors continue to believe that the Fed will raise rates until mid-2017. And instead of three previously planned increases in 2017, may not be more than two.
The Fed lowered its forecast for US GDP growth in 2016 to 1.8% from 2.0%. Today at 15:30 (GMT + 3) published the news flow from the US. Among others - the price index of the US GDP for the second quarter, the annual US GDP in the second quarter (the final version). GDP data are some of the key (along with the data on the labor market and inflation) for the Fed in terms of its monetary policy. GDP forecast for Q2 + 1.3%. If data will be weaker, the US dollar will fall, and vice versa.
Today, like yesterday, full of key speeches by the Fed. The head of the Federal Reserve Bank of Kansas City, Esther George has said today that the differences of opinion among the leadership of the Federal Reserve - a "healthy phenomenon," and "to the extent of improvement in the economy, the Fed should adjust interest rates." However, the timing of a rate hike is also not indicated.
17:00 scheduled speech of the US Federal Reserve member of the Federal Open Market Committee (FOMC) Jerome Powell, and 20:00 - Fed chief Janet Yellen.
Between the publication of macro data and statements by Fed volatility in the financial markets, including the pair AUD / USD, will increase.
Author signals - https://www.mql5.com/en/signals/author/edayprofit


")