
Talking Points
- The USD/JPY Traders Higher, but Fails to Break Critical Resistance
- Intraday Support for the USD/JPY Resides at 105.25
- If you are looking for more trading ideas for the US Dollar, check out our Trading Guides
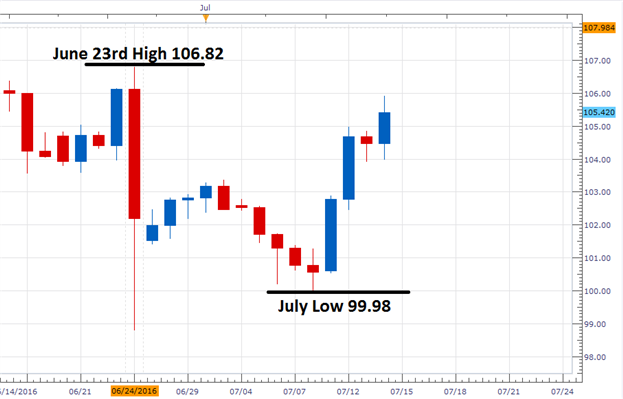
The USD/JPY is now declining off of its high of the day at 105.93. As prices turn lower, traders should note that this week’s rally has still failed to breakout above the June 23rd high at 106.82. If price action fails to find short term support, it may open up the USD/JPY to return back towards critical values of support. This includes intraday support at 105.25, daily price support near 104.00, and ultimately the July low at 99.98.
USD/JPY Daily Chart
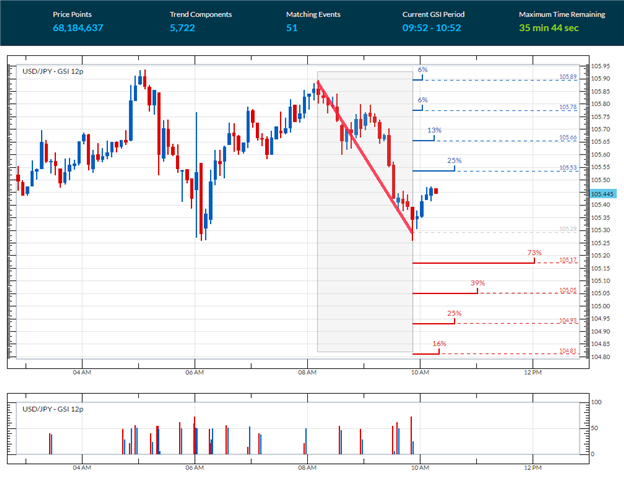
In the graph below, we can see the USD/JPY trading lower off of today’s daily high. The Grid Sight Index has pinpointed this move as a short term downtrend, which has developed over the last two hours. If this bearish momentum continues, traders should look for the pair to trade below the current 5minute swing low at 105.25. To help interpret this market turn, GSI has reviewed 68,184,637 pricing points and discovered the market moved lower by 12 pips in in 73% of the 51 matching historical events. This places today’s first bearish distribution at a price of 105.17. A move to this value would be significant as it would place the USD/JPY back below intraday values of support.
Of the matching historical outcomes, prices advanced 60 pips in 6% of instances. As indicated in the graph below, todays last bullish historical distribution resides at 105.89. A move to this point would suggest renewed bullish momentum, and open the USD/JPY to trade back up towards daily highs .
USD/JPY 5Minute GSI Chart
What is GSI?
Grid Sight Index is a powerful big data indicator that can help you determine whether short-term trends will continue or reverse. GSI takes a snapshot of current price action and uses that to find similar events by studying millions of historical data points. Then it studies those events to show you how often the trend continued or reversed in the past.


")
