USD/JPY Technical Analysis: Abe’s Promise of Stimulus Boosts USD/JPY ~2%

Talking Points:
- USD/JPY Technical Strategy: The Trend Is Clearly Lower
- 200-Week Moving Average Remains The Line In The Sand (106.54)
- ABE: WILL ORDER PREPARATION OF ECONOMIC STIMULUS TOMORROW (BBG Headline)
Watching For a Bear Market Bounce
If this was a year ago, or two years ago it is safe to say USD/JPY would likely be up ~5% on similar news announcements as we heard this weekend. First, Japan’s upper house elections gave a majority to PM Abe’s party, which should provide little resistant to new stimulus being enacted.
There is an inverse relationship JPY and Japan’s key equity index, the Nikkei (CFD: JPN225.) Put another way, the Nikkei and USD/JPY are positively correlated and tend to move in the same direction a majority of the time. Since the weekend’s open after the election outcome was known the current Nikkei futures contract (NKU6) is up ~850 points or 12.5%. Much of this buying pressure came on the back of the following announcement:
ABE: WILL ORDER PREPARATION OF ECONOMIC STIMULUS TOMORROW (BBG Headline)
Since the low at 75.55 in 2011, the anticipation of Federal Reserve Interest Rate hikes or BoJ stimulus has been the wind in the sails of a Bull move in USD/JPY. As of mid-morning on Monday, USD/JPY is up ~2% from Friday’s close.
While there may be more to go to the upside, traders are right to be cautious. To understand where traders may want to look for the upside to move to validate a reversal or to be a potential reversal point, let’s look at the charts.
USD/JPY May Want To Brace For a Bear Market Rally
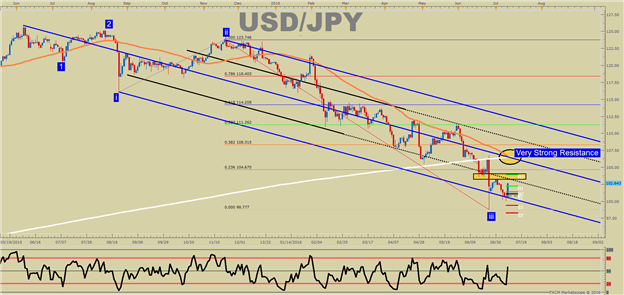
The Technical Picture
The Bearish Price Channel (Blue) is drawn from the June 2015 High, the August 24 low and the November high. This channel has contained the price rather well, and until there is a break above that channel median-line (106.42), it is difficult to say with a straight face that the Bull market may soon resume.
Astute chart-watchers will also not the 55-DMA and 200-WMA all align ~ 106.50. Therefore, there are few resistance points more significant than this level. However, for more tangible resistance, traders should focus this week on ~103.50.
103.50 brings about support pre-Brexit as well as the weekly R2. If price can break above this zone, we have a very good chance of pushing toward 106.50. If 103.50 holds back further price advances, it’s fair to think of this 2% move as part of a Bear Market rally.
Lastly, support is less essential to define due to the strong downtrend. Naturally, the Friday, July 8 low of 99.975 after NFP is the first focus. Below there, you can look to the post-Brexit low of 98.77 and then the 61.8% Fibonacci Retracement of the 2011-2015 range at 94.83.
Given the recent volatility, a new breakdown could easily bring us to these levels. Should we break below these levels, expect to hear from the Bank of Japan more frequently.
USD/JPY Sentiment Shows Bears Are Jumping In Favoring Further Short-Term Upside
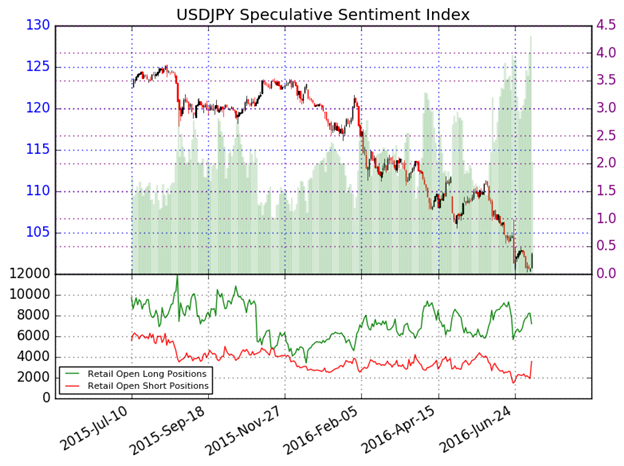
As of mid-day Tuesday, the ratio of long to short positions in the USDJPY stands at 2.06, as 67% of traders are long.Yesterday the ratio was 4.53; 82% of open positions were long. Long positions are 11.0% lower than yesterday and 3.0% above levels seen last week. Short positions are 95.4% higher than yesterday and 60.6% above levels seen last week.
Open interest is 8.2% higher than yesterday and 6.7% above its monthly average. We use our SSI as a contrarian indicator to price action, and the fact that the majority of traders are long gives a signal that the USDJPY may continue lower. The trading crowd has grown less net-long from yesterday and last week. The combination of current sentiment and recent changes gives a further mixed trading bias.
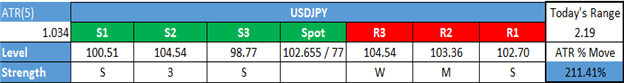
Shorter-Term USD/JPY Technical Levels: July 11, 2016
For those interested in shorter-term levels of focus than the ones above, these levels signal important potential pivot levels over the next 48-hours.


")
