
How Fed estimates changed
- 2016 growth downgraded to 2.0% from 2.2% in the March projection
- 2017 growth downgraded to 2.0% from 2.1%
It's officially a 2% economy (and the Fed has a history of overestimating)
- Unemployment forecasts for 2016 and 2017 unchanged
(There was some speculation the 2016 forecast of 4.7% would be lowered because we're already there)
- 2016 PCE inflation raised to 1.4% from 1.2% but 2017 and 2018 unchanged
(This is likely due to the rebound in commodity prices)
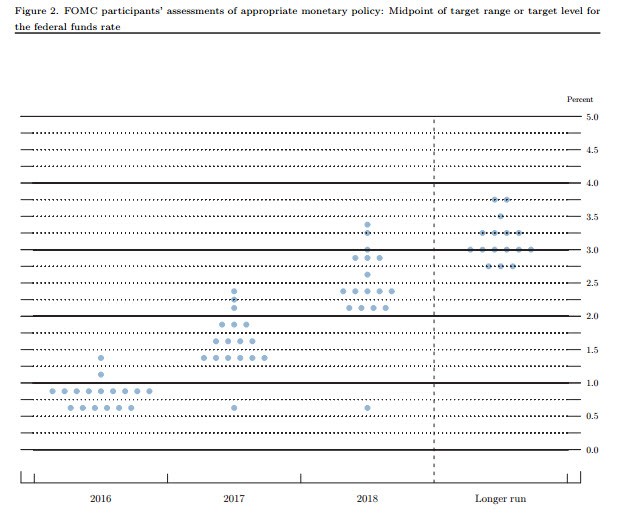
- Longer-run Fed funds rate estimated at 3% versus 3.25% in March
Here are the changes in the dot plot.
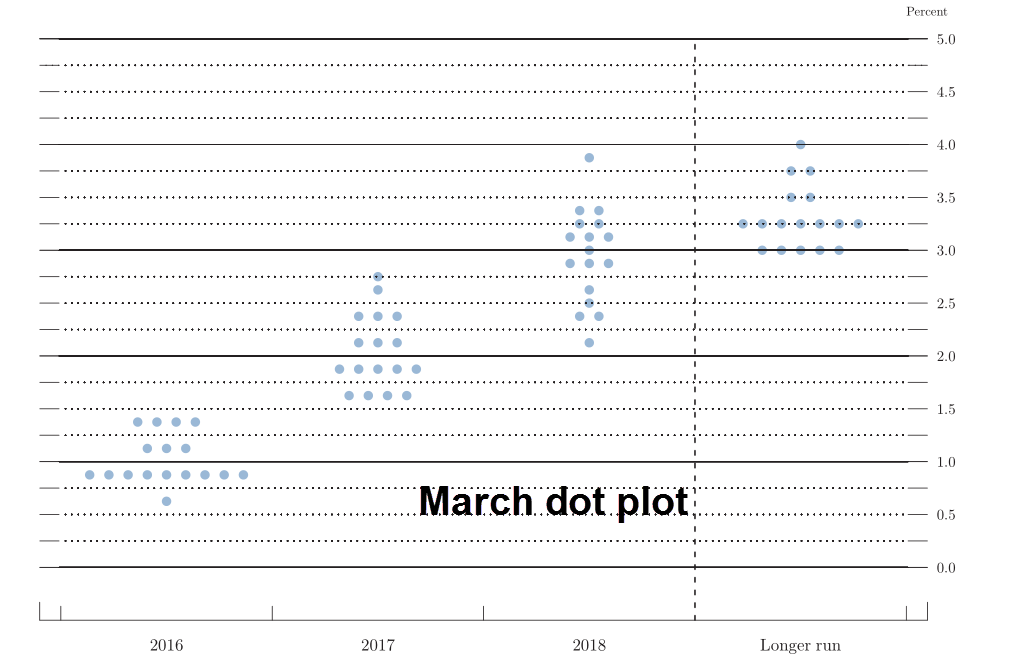
New dot plot
The majority still sits at two hikes this year, but it's 11-6 now compared to 16-1 in March
Note the extremely low dot in 2017 and 2018. Most will say Evans but he's been less dovish. Brainard possible because she's been dovish but Kashkari is a rebel and he's the most likely for me. Either that or Kocherlakota snuck in a forecast.


")
![[XAUUSD]: Weekly Liquidity Activation Points (timings), June 22-26, 2026](https://c.mql5.com/6/1013/splash-preview-771790.png "[XAUUSD]: Weekly Liquidity Activation Points (timings), June 22-26, 2026")
