
Trading volume contribution to trade decisions.
Trading volume is a trend confirmation indicator in the event that the types of trade are aligned with the trend. By gauging the trading volume, we ascertain trend momentum. For example, if a price decline is followed by high trading volumes, it can be inferred that many and robust investors, are currently considering that lower prices are anticipated and sell. In this example, a lingering downtrend is confirmed. The type of trading position (long/short) could be examined in terms of shorter timeframes. If the trades in this short timeframe are long, then the overall movement is long.
COSMOS4U Volume indicator provides the trading volume of the monitoring symbol per timeframe. In other words, we can monitor trading volume over a unit of time (15’, 1-hour, 4-hour, daily, weekly, monthly). The length of each vertical bar illustrates the corresponding trade volume.
Provided that the current closing price is higher than the one over the previous timeframe, it is presumed that buyers outnumber sellers and the bar is displayed in blue regardless of trading volume. Conversely, when the current closing price is lower than the one over the previous timeframe, it is presumed that sellers outnumber buyers, and the bar is coloured red. If the closing price is equal to the previous one, then it considered that there is an exact match between the number of buyers and sellers and the bar is presented in purple.
The moving average line is plotted on the volume bar chart and coloured purple. It illustrates the level of average trading volume. It is therefore useful to compare the current trading volumes with the moving average and make decisions that are contingent on the current trade volume in association with the average one. For example, if we see that the current trade volume is higher than average (two/three times), then we could consider that this volume can confirm the current trend. Admittedly, smaller than average trading volumes do not confirm the current trend. For example, if there is a price decline along with small volumes, then this is not indicative of a downtrend.
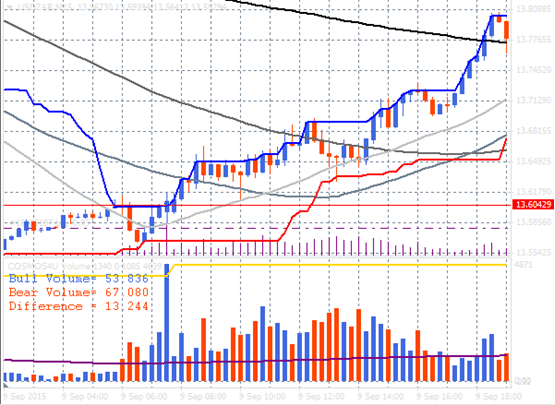
Volumes that match a previous higher high or hit a new high are regarded as very high volumes. In the diagram of USDZAR above, in 09.09.2015, the long blue bar defined a new volume high and validated an uptrend. Such heavy volumes must be considered as significant signs, especially over the next timeframe, because they provide a) trend strengthening or reversal or b) sharply closed opposite positions. If the next bars are bullish, then the trend has been reinforced, but if next bars are bearish and the trend is changing then probably there were closed positions in the previous timeframe as well as a trend reversal.
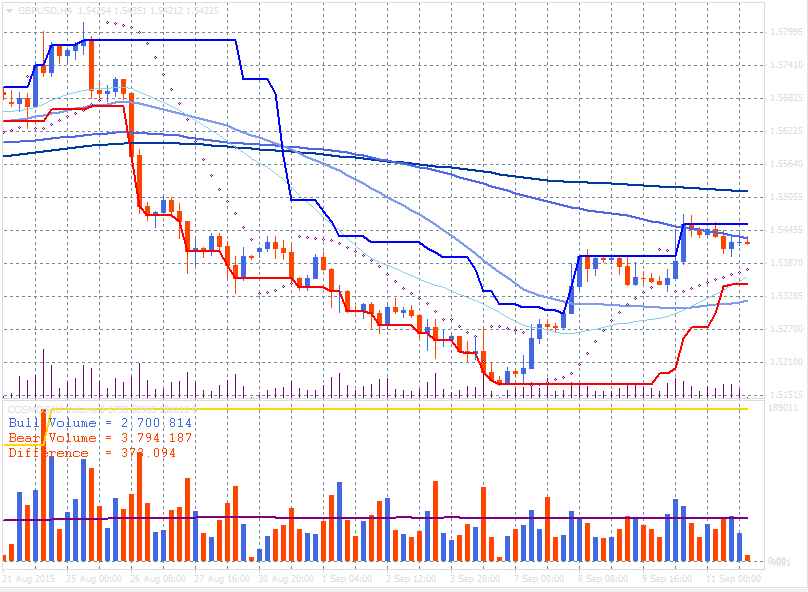
In the following image, there is a GBPUSD diagram displayed using an H4 timeframe, from 21 Aug 2015 – 11 Sep 2015 where you can locate the heavy trading volume of sales in 22 Aug 2015 which resulted in a downward trend. This trend in 11 Sep 2015 brought about the long and short difference of 373.094 trades on the part of sellers.
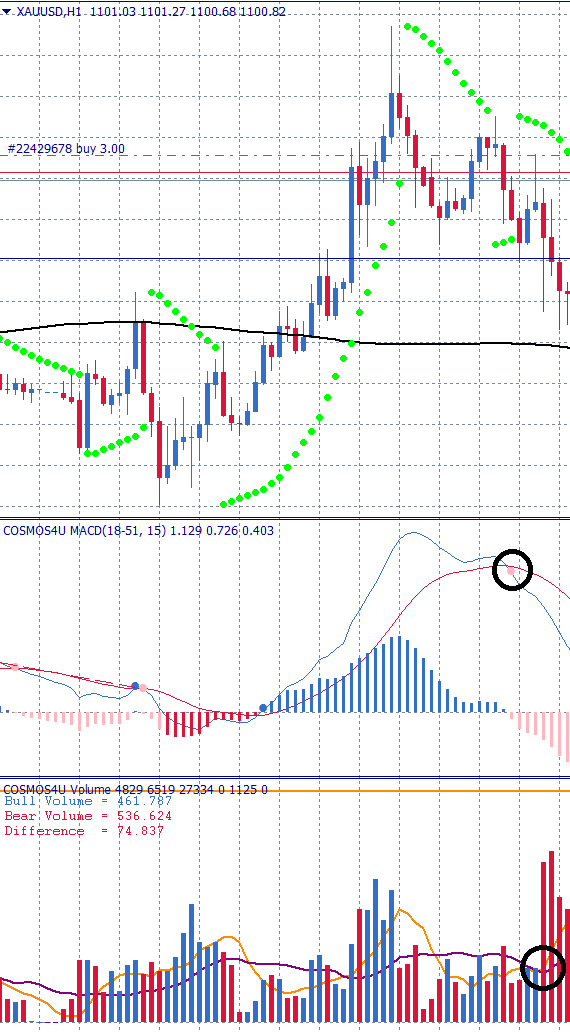
The updated COSMOS4U Volume Indicator is empowered with the ability to display two (2) moving volume averages. Ideally, the two moving averages could be parameterized, so that the former is set in short term and the latter in medium term periods. Due to outbreaks of volumes, a trend confirmation signal could be validated, when slow moving average is crossovered in uptrend by the slow. In the following XAUUSD diagram, it seems that after COSMOS4U AdMACD sell signal, heavy volumes confirmed the trend. Fast volume moving average breached the slow in an uptrend.
Opposition between volumes and development trend.
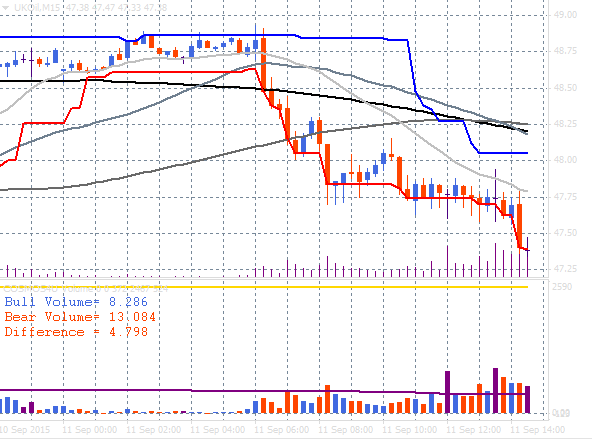
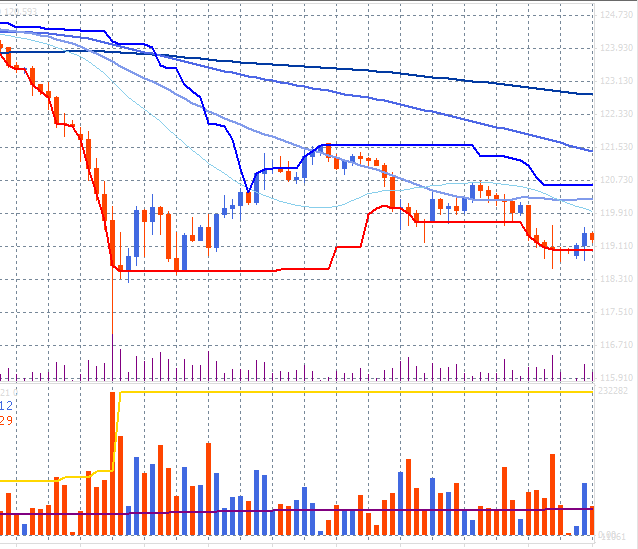
Heavy volumes, either on the part of buyers or sellers, enhance and maintain the trend where the symbol accumulates strength in a narrow values’ range or keeps moving along the current trend. But there are cases of a sales boom when the price is in a forced decline trend as well as a buys boom when the price hits a higher high price. In these cases the investors should be cautious and avoid opening clue positions directly. He/she must wait for one or two more time frames to close in order to assume a new position. In the following chart of USDJPY, H4, 23 Aug 2015-7 Sep 2015, after a period of decline, and orgasm of sales occurred and the trend was reversed.
Examples of price and volume charts.
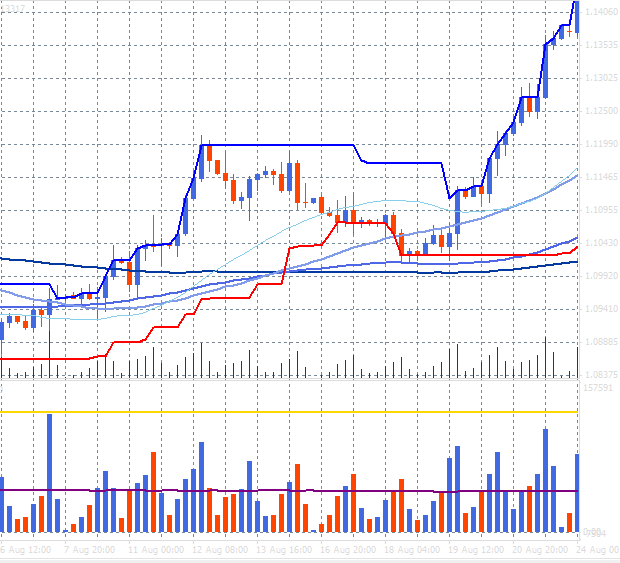
EURUSD, H4, 6-24 Aug 2015
We observe heavy volumes on August 6th, 2015 that matched the level of the previous high (golden line.) Then an upward trend in the upcoming 4-hour timeframes appeared and was confirmed by buying volumes (blue bars). The correction (pull back) was supported by lower selling volumes until August 19, 2015, after which the upward trend was pivoted by heavier than market average volumes.
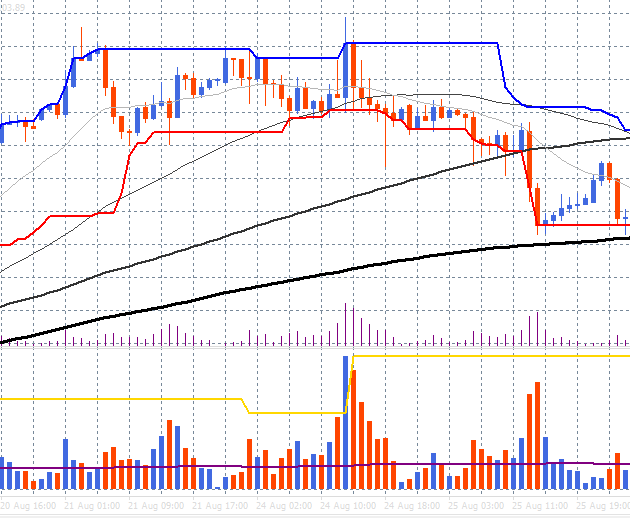
XAUUSD, H1, 20-25 Aug 2015
We observe, on August 24, 2015 that buying volumes set a new high (golden line) and after this boom, in the upcoming time frames, strong selling volumes by sellers appeared. Moreover, the buying volume boom appeared during an ongoing upward trend. This is another case where the buying heavy volumes are reversing the trend. This event is interpreted as follows: At high prices, buyers assume long positions, in order to drive the price higher and create new highs. On the other hand, sellers, who opted for short positions at lower prices in the past, appear too. Given that sellers outnumber buyers, the value does not exceed the previous high and it cannot breach the last resistance. Technically, at this point, a short signal is generated. After the first group of sellers who prevented the uptrend continuation, a second group of sellers appears due to the above technical signal, and accentuates the decline.
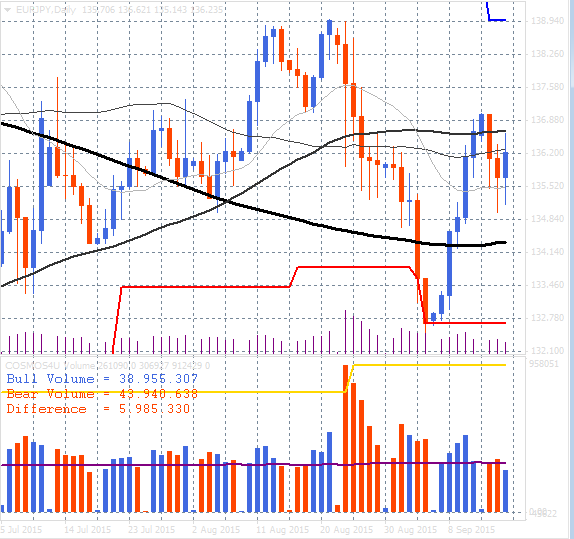
EURJPY, D, 5 Jul - 16 Sep 2015
On August 24, 2015 a heavy selling volume set a new high (golden line) as well as a trend reversal, which prevailed over the following days, until September 4, 2015. On that day a new trend reversal was supported by heavier than average trade volumes. These examples validate trend confirmation through volumes.
Indicator customization.
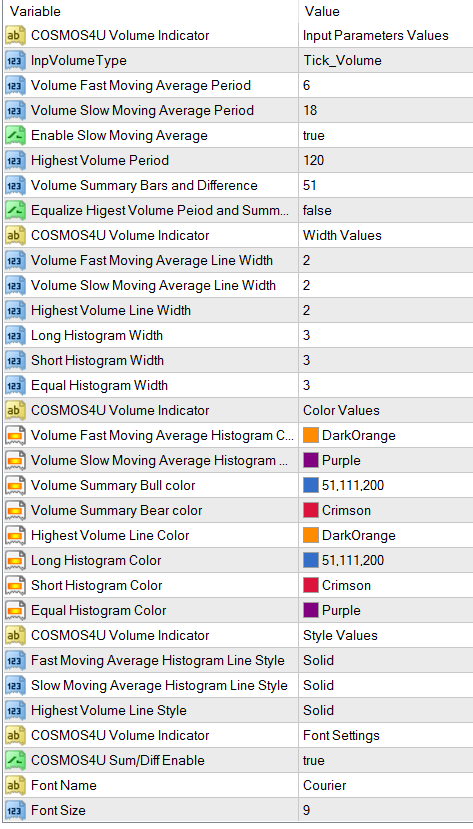
The COSMOS4U Volume Indicator, is fully customizable by means of many parameters like colors, fonts, line types, color bars types etc. The most important parameter factors that influence our decisions are the following:
Volume Moving Average Period
- Default value = 48. This parameter sets the number of timeframes which the moving average is calculated by. For example, if the user selects the hourly chart and the period equals 48 then the purple line displays the average volume of the previous 48 hours (2 days). If, the user uses the daily chart and the period equals 25 then the purple line displays 25-day moving average (approximately 1 month). Settings combination with an additional technical indicator can be adjusted accordingly. For example, if the Volume Indicator is used along with AdMACD indicator, then the fast and middle average could be the same for both indices’ settings as AdMACD (f, s, g) & Volume (f, s).
Volume Summary Bars and Difference
- Default value = 120. This parameter represents the number of timeframes that sums of long and short types of volume are calculated by separately. In addition, the difference between long & short types of volumes is calculated through this value. For example, if the user selects the hourly chart and the setting equals 240, the sums of the long and short types of volume are calculated for the previous 240 hours (10 days). If, for example, the user selects the daily chart and the period is set at 75, the sums of the long and short types of volume are calculated for the previous 75 days (approximately 3 months) as well as the difference between them
Highest Volume Period
- Default value = 120. This parameter represents the number of time frames within which the heaviest volume is pinpointed. For example, if the user selects the hourly chart and the setting equals 240 then the gold line displays the maximum volume value that occurred within the previous 240 hours (10 days). If, for example, the user selects the daily chart and the period is set at 75 then he will observe the heaviest volume that occurred within the preceding 75 days (approximately 3 months).
These settings could transform the indicator into a powerful and useful tool for trade decision support under specific circumstances. It depends on periods’ settings. This has a great impact on trades and placements in high volatility foreign exchange markets via brokers that support leverage.
Conclusions.
The most important features of COMSOS4U Volume Indicator for trend confirmation signals, are the following:
- Long signal is confirmed after a downtrend reversal along with price reaction at higher values, supported by volumes heavier than average (2-3 times heavier, depending on the setting of the time period average). If a new high on volumes is defined, it is an even more valid signal than the previous one.
- Short signal is confirmed after an uptrend reversal along with price reaction at lower values, supported by volumes heavier than average (2-3 times heavier, depending on the setting of the time period average). If a new high on volumes is defined, it is an even more valid signal than the previous one.
- Caution is needed when a buying volume boom appears during an ongoing upward trend. Vigilance is of paramount significance too, when a sells boom appears during an ongoing downward trend. Prices’ top or bottom formation is likely to emerge, respectively.
- There is no trend confirmation if the volumes’ levels are lower than the average trading volume (it depends on the moving average period setting).
- Period parameters’ values are crucial for the calculation/selection of
- Volume moving average,
- high volume,
- volumes’ sums
- difference between buying and selling volumes.
The use of the indicator relies on the efficiency of the applied parameters.
Parameters for the COSMOS4U AdMACD indicator can be found at the following addrees:
For Metatrader COSMOS4U products and updates, click
https://www.mql5.com/en/users/cosmos4ucom/seller#products


