Analytical Review for Altria Group Inc.'s Shares
Altria Group Inc., #MO [NYSE]
Consumer goods, Cigarette production, USA
Financial performance
Index – S&P 500;
Beta – 0.51;
Capitalization - 121.98 В;
Assets Profitability - 19.10%;
Revenue - 5.24В;
Average volume – 6.36 М;
P/E - 23.33;
ATR – 1.08.
Analytical review
- The issuer has been in an upward trend since the beginning of 2016. In the past 3 months, the price of Altria Group’s shares has grown by over 7.5%.
- The company has the second biggest capitalization in the cigarette production sector of the US stock market.
- The company's revenue grew by $912 million (3.7%) up to $ 25.43 billion in 2015. The EPS factor (earning per share) amounted to 2.67 USD against a year-ago value of 2.56 USD. It should be noticed that the company's management predicts a 7%-9% EPS growth this year.
- The Company's ROE (return on equity) is the highest in the industry and amounts to 177.50% while the average value does not exceed 43.76%.
- A press release on the company's performance in 1st quarter 2016 is to be announced next week. The Company's management will answer investors' questions and issue a forecast for the years 2016-2017.
- Over 60% of shares belongs to institutional investors. The largest shareholders are Vanguard Group (5.94%) and Capital Research Global Investors (4.42%).
Summary
- Altria Group's results in fiscal year 2015 strengthened investors' confidence in the company's activity. Despite the pressure of the strong dollar, the company registered a growth in net profit and sale volumes. The major part of the company's shares belongs to institutional investors. An upbeat press release on the first quarter of fiscal year 2016 would be a driver of the company's further growth in value.
- Thus, we expect that the company's quotes will be rising in the nearest future.
Trading tips for Altria Group Inc.'s CFDs
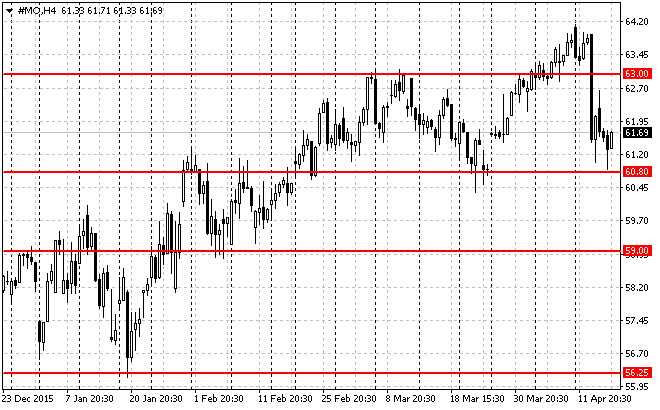
Medium-term trading: the issuer is trading at 60.80-63.00 USD. Once the upper border of the trading range at 63.00 USD is broken and tested, and relevant confirming signals appear (Price/Action patterns, for example), we recommend searching for market entry points to open long positions. Risk per trade: no more than 2% of equity. Stop order shall be placed a bit below the signal line. We recommend that prospective profits should be fixed partly at the levels of 64.50 USD, 66.00 USD and 67.50 USD, with Trailing Stop applied.

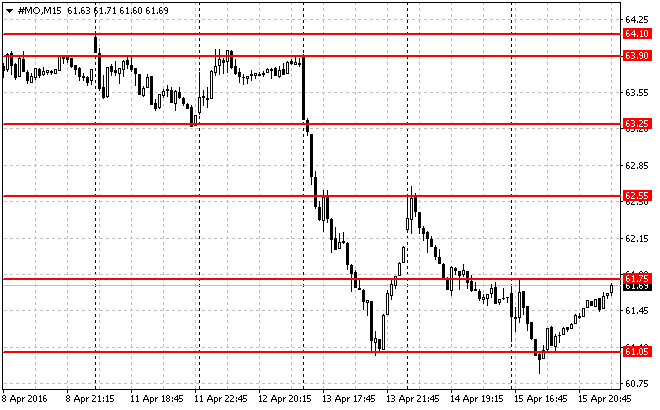
Short-term trading: On the 15M time-frame, the issuer is currently trading between the local support and resistance levels of 61.05/61.75 USD. We advise you to search for market entry points once these levels are broken and tested. Positions shall be opened in the direction of the signal line and the nearest support/resistance level. Risk per trade: no more than 3% of equity. Stop order shall be placed a bit above/below the signal line. Prospective profits shall be fixed partly, at 50%, 30%, and 20% of a prospective fluctuation, with Trailing Stop applied.


