Analysis :
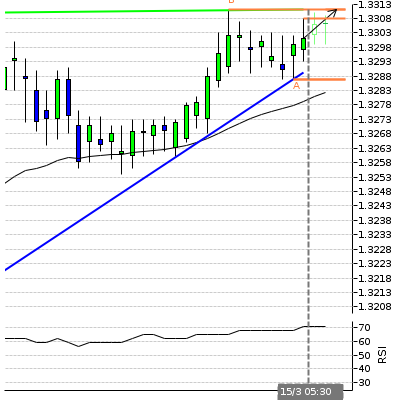
Ascending Triangle identified at 15-Mar-05:30 2016 GMT. This pattern is still in the process of forming. Possible bullish price movement towards the resistance 1.331 within the next 5 hours.
Supporting Indicators :
Upward sloping Moving Average
Resistance Levels :
( B ) 1.3311Last resistance turning point of Ascending Triangle.
Support Levels
( A ) 1.3287Last support turning point of Ascending Triangle.-