- Analysis :
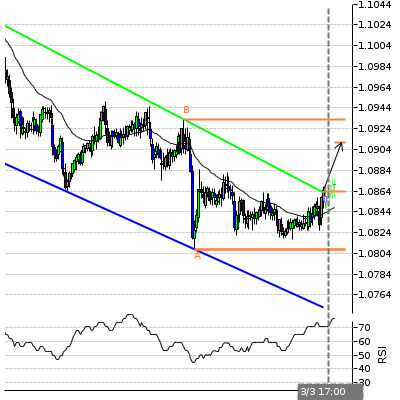
Channel Down has broken through the resistance line at 03-Mar-17:00 2016 GMT. Possible bullish price movement forecast for the next 3 days towards 1.091.
Supporting Indicators :
Upward sloping Moving Average
Resistance Levels :
( B ) 1.0933Last resistance turning point of Channel Down.
Support Levels
( A ) 1.0808Last support turning point of Channel Down.