
Trading with the use of Bollinger Bands
Bollinger Bands supports price movements. It can accommodate in times of heavy volatility and narrowing of the times in which oscillations are low. In general, it is adjusted based on the size of the market movements and oscillations.
There are two conditions we look them in any trading opportunity. We want to buy when prices drop down to the support when the market is on an upward trend; and we want to sell when prices accelerated upwards towards the resistance when the market is in a downtrend. Bollinger Bands usually provide good levels of support and resistance for the trading of our plan, so you should just make sure that we track the couples that follow the strong trends.
Let's look at an example provided by the daily chart of the USD / CHF below.
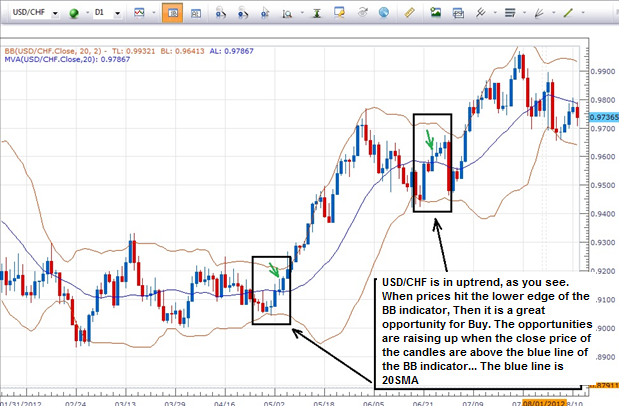
Including an upward trend, we note the presence of a series of peaks and lows Top Top, references to the need to keep an eye out any retreat towards the support (lower) border in order to take advantage of buying opportunities. Two examples Azahran on the drawing ... The first occurred in May and the second in June this year. Hot prices down to the lower Bollinger lines in the examples mentioned by Almsttilin. However, it is not necessary to enter long positions, but it is considered as signs start looking for buying opportunities when you get a reversal.
Traders will use a variety of means in order to determine the price of entry, based on the use of preferred indicator they have down to just buying after the market rise above the previous peak. A common approach provides for the purchase when the first candle closes above the middle line ... the arithmetic average of twenty days. This is as a greater emphasis on reflection and increases the chances of success of the trade. (In the graph above, it referred to as "candle purchase" by a green color share). If traders can put stop losses without protectionism shadow points down and looking to get a percentage of the risk / gains of up to 1: 2.
It should be noted that the movements of the dollar / Swiss franc prices fell and touched the lower Bollinger lines four times during the past few days. That means that we should search for an opportunity to buy a new opportunity.
But instead of just at the moment of purchase, the time might be appropriate to use your approach in order to monitor those buying opportunity in order to increase trade success ratios. Prices have rebounded after testing the lower lines in the past week. The patience, order and wait until the occurrence of the first closing above SMA twenty days may be a way to enter this trade through the use of Bollinger Bands strategy that I learned just now.


")
![[XAUUSD]: Weekly Liquidity Activation Points (timings), June 29 - July 3, 2026](https://c.mql5.com/6/1014/splash-preview-772062.png "[XAUUSD]: Weekly Liquidity Activation Points (timings), June 29 - July 3, 2026")