Many traders know about candle patterns and use some of them as an additional signal for trading. This method is very intuitive because of its graphical representation. Unfortunately this simplicity conceals a flaw which is not visible at the first sight.
All candle patterns rely on bars' geometry. And all conventional bars or candles are formed by price movements in time. But the time itself is continuous, whereas on bar charts, time is sliced into artificially aligned chunks. It's obvious that, for example, a hourly bar will most probably change its geometry completely if its starting time is shifted by a fraction of an hour. As a result, an existing candle pattern may vanish visually, yet the underlying price movements remain the same.
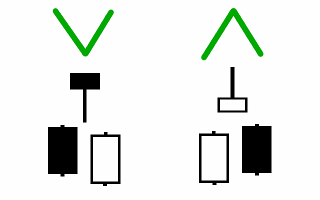
If you look at popular candle patterns, you can easily perceive that they are produced by very similar price movements, and the most important difference between them is just the time origin of the moments, when characteristic bars of the figures were started. For example, if you shift time axis by a half of bar size, a "hammer" may (or may not) metamorphose into a "piercing", or a "hangman" - into a "dark cloud cover". Bearish or bullish "engulfing" is also a possible outcome of such trick with time, depending from actual price action and time shift. And if you switch your chart to a smaller timeframe, you may discover that morning and evening stars are also translated into abovementioned figures on a larger timeframe. So every pattern is just a matter of time origin and scale. All patterns are eventually made up by the following general price movement:
The question is: how can we detect candle patterns regardless to the time origin? This is even more important, because of different time-zones used by trading servers all over the world. Apparently, no one wants to miss a pattern, even if it was formed in candles for a different time-zone.
And the answer to the question is yes. The indicator
TimeShift allows you to analyse how existing quotes would look like under different time origin and discover specific candle patterns invisible otherwise. You just need to specify an offset as a number of smaller timeframes to be used for shifting current timeframe chart in future.
On the screenshot below you may see EURUSD M15 chart with the TimeShift indicator. Its offset is 5, which means that every M15 bar opening time is shifted by 5 minutes into the future (bars start at every 5-th, 20-th, 35-th, and 50-th minute of an hour). For your convenince some new reversal figures - "hammers" and "hangmans" - are marked by arrows. It's important that the figures are not discoverable on the original M15 chart.
The marks themselves are not a part of the published indicator, because it just provides an alternative view of the quotes. Yet, having such an indicator it's easy to work out algorithmic detection of any candle patterns of interest, add alarms, incorporate it into an expert adviser, and further extend your analytical capabilities.


