Summery:
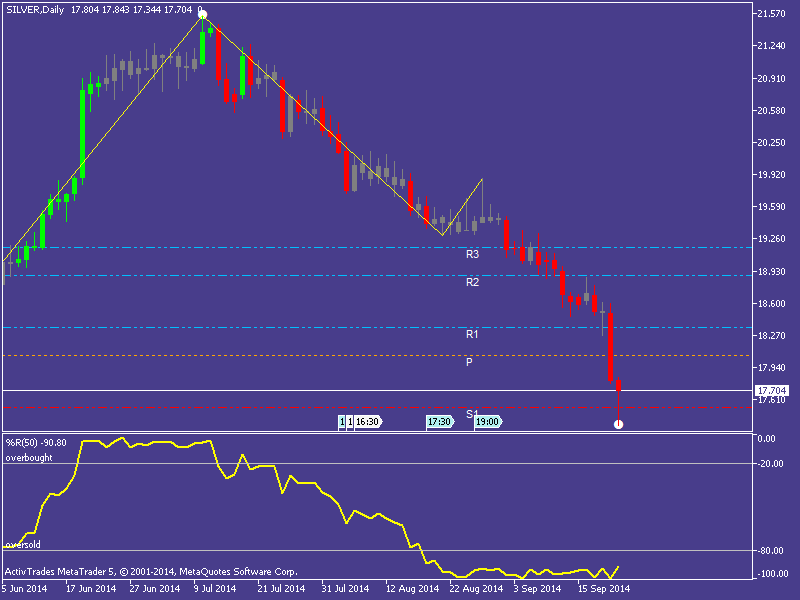
Primary Trend: Bearish (last low white dot not yet confirmed)
Secondary Trend: Bearish (see last zigzag)
Pivot: 18,062
S1: 17,529
R1: 18346
Comment: All
indicators on chart show a big bearish trend. Price are trying to find a support on S1 so we will understand more on what to do in closing bar if doesn't breakdown.
Volumes are inside the Oversold zone.
Suggestion:
If you have entered short before it may be good start thinking to close
position now on this peak. Otherwise is better to wait next bars and see a green candle,
a breakup of R1 and exit from Oversold zone to enter long and catch a
new Big Trend.
Warning: what will happen to prices no one can know, that belongs to the future.
Good Luck!


