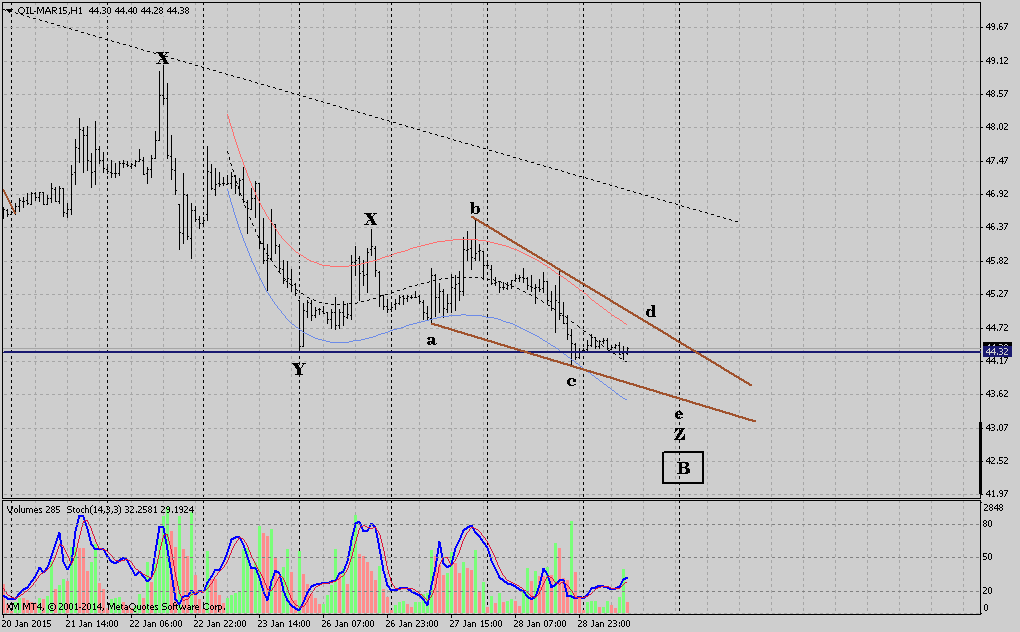
All Blogs / Market News / Crude Oil All Blogs Analytics & ForecastsWeekly TrendsForecastsTrading SystemsMy TradingChartsTrading StrategiesStatisticsTrading IdeasScalpingNeural NetworksWave CountMarket NewsCurrencyMetalsCrude OilCompany NewsEventsBanksBrokersLaw/RegulationsOther Rules Crude Oil Chart pattern Analysis: Crude Oil" Emerging Bullish wedge" 29 January 2015, 10:33 kolioo77 0 145 Crude oil touching the Bottoms forming Bullish wedge expected to complete @ $43 ,Breakout upside will bring higher prices towards $46 to $51 To add comments, please log in or register Asymmetric Alpha Generation and Algorithmic Liquidity Scaling: Why Bitcoin is the Ultimate Asset Class for Quantitative Currency 40 0 Why XAUUSD Technical Analysis Fails Market News 48 0 1 The Golden Dilemma: Why Gold Trading is Both the Holy Grail and the Ultimate Nightmare for Financial Markets Currency 75 0 Forex - Liquidation Zones Currency 72 0 Free Live Global Economic News Television Market News 92 2 3 The Human Variable: Why Every Serious Trader Eventually Removes Themselves From the Equation Trading Systems 3 0 NT Trade Manager — Complete User Manual Trading Systems 15 0 Five Structural Failures I Find in Most "Working" EAs Trading Systems 15 0 Confluence Scoring for Smart Money Setups: Turning 7 Signals Into One Number in MT5 Trading Systems 25 0 347 Why Do So Many Traders Lose Profits They Already Earned? 25 LAP — Liquidity Activation Point: A New Perspective on Studying Financial Markets Through Time 70 Cup & Handle MT4 forex technical analysis eurusd EUR/USD gbpusd gold usdjpy GBP/USD usd/jpy usd Trading AUD/USD usd/chf S&P 500 forecast usd/cad Fed bitcoin Fxwirepro dax fundamental analysis VistaBrokers Gold spot ($) Silver spot ($) Crude Oil (WTI) USD/TRY audusd EUR forex news ECB