
Limitless Opportunities with MetaTrader 5 and MQL5
"To get somewhere, you have to go through something, otherwise you will not reach anywhere."
Table of ContentsIntroduction
1. Trading System Conditions
2. External Parameters
3. Parameter Optimization
3.1. First Set-Up Variant
3.1.1. General Parameters and Rules
3.1.2. Tester Settings
3.1.3. Analysis of the Obtained Results
3.1.4. BOOK REPORT Application for the Analysis of Optimization and Testing Results
3.1.5. Money Management System
3.2. Second Set-Up Variant
3.3. Possible Set-Up Variants
4. Testing in the Visualization Mode
5. Interface and Controls
6. Information Panels TRADE INFO and MONEY MANAGEMENT
7. Trade Information Panel on the Left Side of the Chart
7.1. PARAMETERS SYSTEM
7.2. CLOCKS OF TRADING SESSIONS
7.3. MANUAL TRADING
7.3.1. BUY/SELL/REVERSE Section
7.3.2. CLOSE POSITIONS Section
7.3.3. SET PENDING ORDERS Section
7.3.4. MODIFY ORDERS/POSITIONS Section
7.3.5. DELETE PENDING ORDERS Section
7.4. TRADING PERFORMANCE
7.5. ACCOUNT/SYMBOLS INFO
8. Additional Indicators to be Used by the EA
Conclusion
Introduction
In this article, I would like to give an example of what a trader's program can be like as well as what results can be achieved in 9 months, having started to learn MQL5 from scratch. This example will also show how multi-functional and informative such a program can be for a trader while taking minimum space on the price chart. And we will be able to see just how colorful, bright and intuitively clear to the user trade information panels can get. It will be shown how far you can go in system building, combining numerous strategies or signal groups, while preserving maximum convenience and the ability to obtain a value of any system parameter in one click.
I would also like to share my opinion on what to look for when optimizing the parameters and testing the system. What to give an eye to when setting the Money Management System. What maximum performance you can hope to squeeze out of the system using only one standard indicator with a single parameter. What a detailed trade report might look like and how multi-functional it can be. And finally, this article can give some ideas on how the resources for automated, semi-automated and manual trading can be combined in one program.
The difficulty level of this article is primarily medium. By the medium level of difficulty I mean that it is aimed at those who are currently in quest of information while studying the subject and do not yet have sufficient skills to get down to real trading because subconsciously, they still get the feeling that something is missing. This article can also be considered as a template of a requirements specification for a developer.
One may at this stage simply lack the knowledge of some features that will be described below and having read the article, place an order for the implementation of some appealing idea in the Jobs service or even do something similar on their own, subject to programming experience. Code examples will not be given here as the article per se is very long and the analysis of relevant codes will require to be covered in separate articles.
This article can also be treated as a demonstration of the MQL5 resources coupled with a great number of ideas. I will provide references to some ideas, or better said, templates I had to consider in order to choose a further direction of the system development.
Before we proceed, I remember once reading in a book on trading in financial markets that a profitable system may be simple insomuch that its description would fit on your car bumper. I have tried a lot of simple systems which unfortunately didn't work out quite that way... But it certainly does not mean that such systems do not exist. :)
1. Trading System Conditions
Trading system conditions are based on crossing levels in the price chart. The levels are determined by the modified indicator Price Channel. There is a total of five levels that trigger purchase, sale or reversal of an existing position when crossed by the price.
The Figure below shows what the Price Channel indicator looks like:
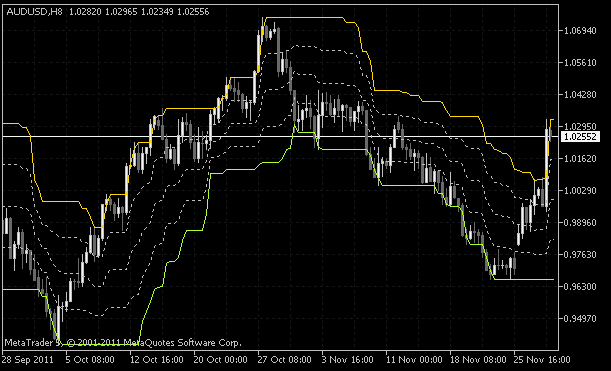
Fig. 1. Modified Price Channel indicator (5 levels)
These levels will be hereinafter referred to as follows (listed from top to bottom):
- H_PCH - The level based on bars maximums;
- MH_PCH - The level calculated as the midpoint between the maximum and the center of the price channel;
- M_PCH - The level calculated as the midpoint between the maximum and the minimum of the price channel;
- ML_PCH - The level calculated as the midpoint between the minimum and the center of the price channel;
- L_PCH - The level based on bars minimums.
Crossing of a certain level is considered to be true if the bar is fully completed. That is, you trade using only completed bars.
Conditions for opening, closing or reversal of an existing position in this system are divided into four groups:
- Upcrossing of the level ML_PCH indicating a buy signal / Downcrossing of the level MH_PCH indicating a sell signal.
- Upcrossing of the level M_PCH indicating a buy signal / Downcrossing of the same level indicating a sell signal.
- Upcrossing of the level MH_PCH indicating a buy signal / Downcrossing of the level ML_PCH indicating a sell signal.
- Upcrossing of the level H_PCH indicating a buy signal / Downcrossing of the level L_PCH indicating a sell signal.
Price gaps are frequent and should also be taken into account. An additional condition is therefore added to the above conditions to check whether the crossing has really taken place.
That is, when, for example, a completed bar does not suggest the crossing yet the opening price of the new bar is beyond the given level. There is in fact a lot of different situations that cannot be observed at a glance so the development of a trading strategy should be very thorough. I handle the generation of trading signals in the visualization mode, carefully analyzing different parts of historical data step by step.
Each group of the above listed conditions works independently as an individual trading strategy without overlapping other conditions. The EA traces what group a certain position belongs to using magic numbers. In MetaTrader 5, there can only be one position per symbol so opening a subposition where there is already an open position in place based on some condition, would basically increase or decrease the total position volume.
To familiarize yourself with this issue and have a look at the codes for implementation of such things, you can read the articles: "The Optimal Method for Calculation of Total Position Volume by Specified Magic Number " and "The Use of ORDER_MAGIC for Trading with Different Expert Advisors on a Single Instrument". There, in the discussion following the articles, one of the authors outlined some problem points that require further improvement.
All possible cases (that I found) where subposition volumes may be incorrectly recorded were solved.
Below are the situations where the volumes may be incorrectly recorded:
- Closing a position or all positions with a magic number that cannot be found in the EA.
- Closing a position or all position using standard resources of the terminal. The magic number in this case is missing.
- Closing a position by Stop Loss or Take Profit.
- Closing a position by Stop Loss, Take Profit or pending orders with other magic numbers or without them during the no-connection periods.
- The EA is guided by values of global variables. If they are deleted, the EA restores them with the same values to keep the correct records.
- Recompilation of the program, removal of the chart followed by its restoration, deletion of the EA followed by downloading the same, restarting the terminal or a computer.
In all of the above situations, the EA re-establishes the correct subposition volume records. With the existing scheme, the EA can be developed so that it takes into consideration any other situation that may lead to incorrect records. I have called this scheme the magic point. :) And I believe this issue deserves a separate article.
Stop Loss and Take Profit levels are set for every subposition. Again, since these levels as such can only be set once, pending orders, which are essentially of the same nature, are set when a position is being opened instead of actual Stop Loss and Take Profit, provided always that there is a permanent Internet connection. That is, if a subposition, e.g. BUY, is opened based on a certain condition, pending orders with the same volume are set immediately.
Stop Loss is replaced by the pending order Sell Stop and Take Profit is replaced by the pending order Sell Limit. Permanent Internet connection is required due to the fact that if a certain order related to a certain subposition goes into action at the server's side during the period of no connectivity, the opposite pending orders will not be deleted and should such period of no connectivity continue, the result might be difficult to predict.
You should therefore ensure maximum control. For example, backup connectivity solutions or a VPS. A few words will further be said about some other security measures to be taken in case of force majeure events.
VPS (Virtual Private Server) or VDS (Virtual Dedicated Server) represent services that provide the user with a so-called Virtual Dedicated Server.
Below is an example where a BUY position (left) and a SELL position (right) are opened when the first condition (crossing of M_PCH) is met:
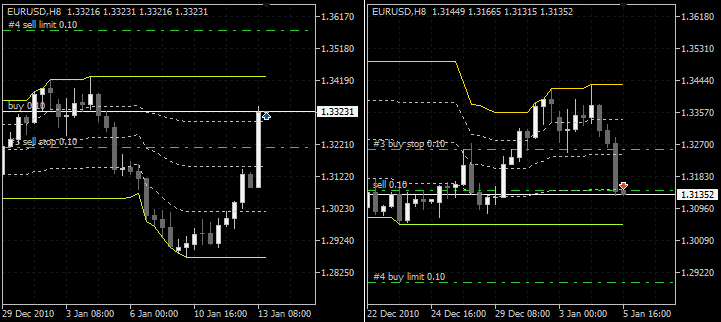
Fig. 2. Opening a position triggered by the first condition
If, while the position was open, Stop Loss (pending order) kicked in, the pending order Take Profit will be immediately removed. The Stop Loss is removed in the same manner if the Take Profit kicked in. Similarly, the algorithm operates for all other subpositions.
Every subposition has its own Stop Loss and Take Profit levels set and the EA removes pending orders when they are no longer needed. If the opposite condition is met while a subposition is already present, a reversal takes place. Pending orders associated with the previous subposition are removed and set afresh for a new subposition.
An example below demonstrates the opening of a BUY position (left) and a SELL position (right) triggered by the second condition (crossing of ML_PCH/MH_PCH):
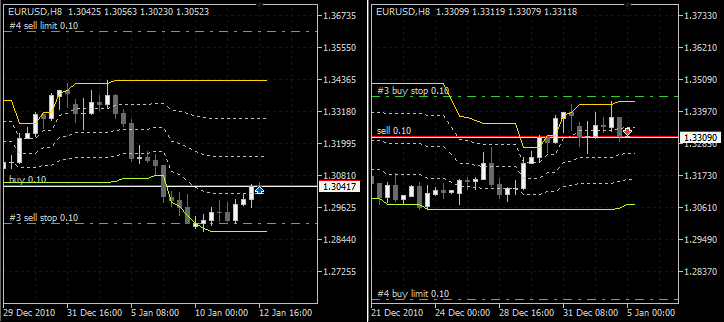
Fig. 3. Opening a position triggered by the second condition
The following examples illustrate position openings triggered by the third (BUY - MH_PCH / SELL - ML_PCH) and fourth (BUY - H_PCH / SELL - L_PCH) conditions:
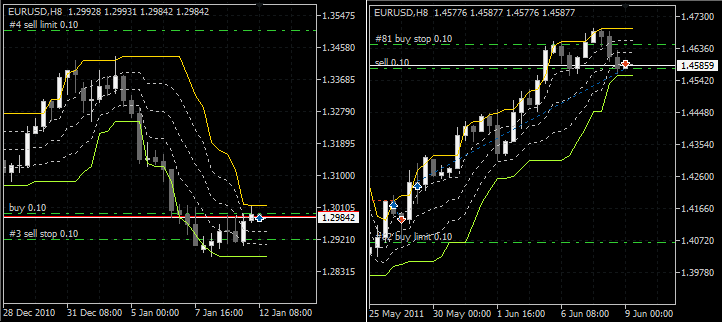
Fig. 4. Opening a position triggered by the third condition
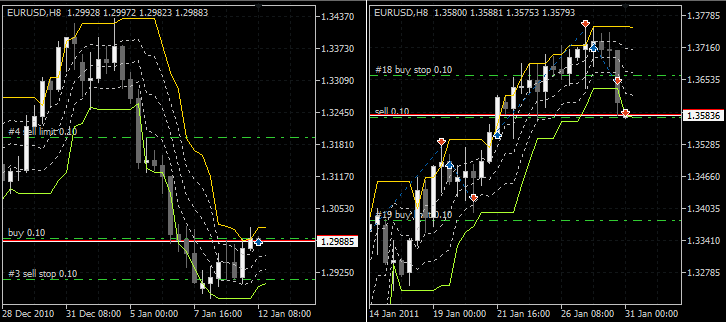
Fig. 5. Opening a position triggered by the fourth condition
For better visual tracking of the signals, the Price Channel indicator has been further broadened. The Figure below shows the indicator with all signaling options enabled:
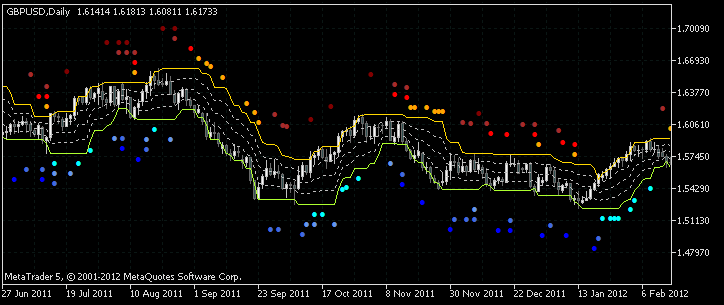
Fig. 6. MultiSignals_PCH indicator
This version of the indicator is available in the Code Base (MultiSignals_PCH indicator). Its detailed description can also be found there. We can only note here that any signal can be disabled in order not to be displayed in the chart which may prove useful when making an operational environment out of the EA that will be demonstrated below.
The scheme described above does not prevent you from a situation when the control over the system may be lost completely leading to the loss of a substantial part of or even the entire account. It all depends on how long you stayed disconnected and how much of the deposit was involved in trading.
A situation of this kind may in fact be very rare but security measures can never be enough where money is involved and you should be maximally ready to different kinds of situations. It is better to overestimate than underestimate. To secure yourself against such force majeure events, you should simply set real Stop Loss and Take Profit levels. They should be set at such a distance that they do not interfere with the EA's operation and only kick in when the control is lost. In other words, they can be called a "safety cushion".
That is, pending orders are always set as Stop Loss and Take Profit levels for all subpositions while real Stop Loss/Take Profit levels are set beyond the most distant pending orders on both sides. The real Stop Loss and Take Profit levels shall be set at the same levels in pending orders because if a pending order is set without them, the position will be unprotected once the pending order has triggered. The Figure below is a good demonstration of the above:
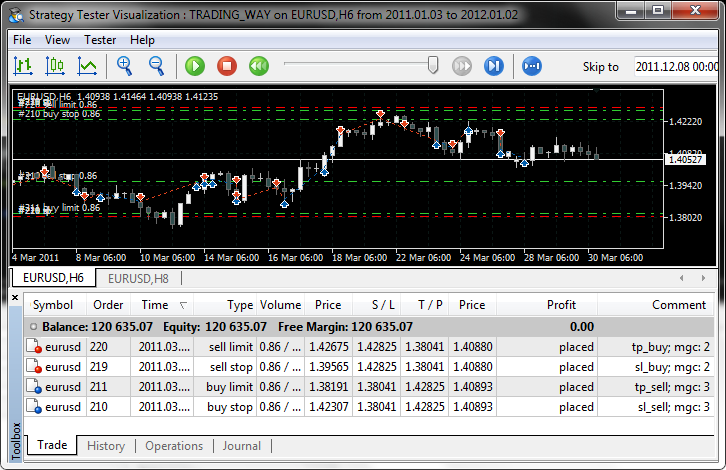
Fig. 7. Stop Loss/Take Profit used as a "safety cushion"
Of course, if the Internet connection is lost right before your eyes, you can contact the broker right away and make the necessary trades over the phone. But if your trading system is set for trading round the clock, the above method will suit you just fine to keep you on the safe side when you are not around. It is very simple and effective.
2. External Parameters
Stop Loss and Take Profit values in the external parameters of the EA are optimized separately for every group of signals. The MultiSignals_PCH indicator period and the time frame on which its values are calculated can also be optimized separately for every group; however there is a possibility to optimize these parameters as common to all groups.
Before making a decision on the EA development scheme, I read a few articles whose authors gave examples of mechanisms for development of multi-currency trading systems. An easy-to-grasp scheme was set forth by Nikolay Kositsin in "Creating an Expert Advisor, which Trades on a Number of Instruments". A more complex scheme employing OOP was proposed by Vasily Sokolov in "Creating Multi-Expert Advisors on the Basis of Trading Models".
The table below features a reduced list of the EA parameters for one symbol (SYMBOL_01) (this version of the EA features 3 symbols) and one trading strategy (TS_01) or a group of signals (this version of the EA has 4 groups for each symbol). Prefix 01 denotes the association with the symbol sequence number not to get lost in quite a few parameters.
| Variable | Value |
|---|---|
| Number Of Try | 3 |
| Slippage | 100 |
| ================================== SYMBOL_01 | |
| 01 _ On/Off Trade | true |
| 01 _ Name Symbol | EURUSD |
| * * * * * * * * * * * * * * * * * * * * * * * * * * * | |
| 01 _ On/Off Time Range | false |
| 01 _ Hour of the Start of Trade | 10 : 00 |
| 01 _ Hour of the End of Trade | 23 : 00 |
| 01 _ Close Position in the End Day | false |
| 01 _ Close Position in the End Week | true |
| * * * * * * * * * * * * * * * * * * * * * * * * * * * | |
| 01 _ Period PCH (total) | 0 |
| 01 _ Timeframe (total) | 1 Hour |
| ---------------------------------------------------- TS_01 | |
| 01 _ Trade TS в„–01 | true |
| 01 _ Timeframe (sub) | 1 Hour |
| --- | |
| 01 _ ## - Type Entry | #1 Cross ML up/MH dw |
| 01 _ Period PCH (sub) | 20 |
| 01 _ ## - Type Take Profit | #1 - Points |
| 01 _ #1 - Points | 250 |
| 01 _ ## - Type Stop Loss | #1 - Points |
| 01 _ #1 - Points | 110 |
| ---------------------------------------------------- TS_02 | |
| ---------------------------------------------------- TS_03 | |
| ---------------------------------------------------- TS_04 | |
| ================================== SYMBOL_02 | |
| ================================== SYMBOL_03 | |
| ---------------------------------------------------------------------- ## | >>> MONEY MANAGEMENT |
| Fix Lot | 0.1 |
| Money Management On/Off | true |
| Start Deposit | 10000 |
| Delta | 1000 |
| Start Lot | 0.1 |
| Step Lot | 0.01 |
| Stop Trade | 5000 |
| --- | |
| Max Draw Down Equity (%) | 50 |
| Stop Trade by Free Margin ($) | 3000 |
| Stop Loss/Take Profit by Disconnect (p) | 15 |
| ---------------------------------------------------------------------- ## | >>> OPTIMIZATION REPORT |
| Condition of Selection Criteria | AND |
| 01 _ Statistic Criterion | Profit |
| - 01 _ Value Criterion | 0 |
| 02 _ Statistic Criterion | Profit Factor |
| - 02 _ Value Criterion | 2 |
| 03 _ Statistic Criterion | NO_CRITERION |
| - 03 _ Value Criterion | 0 |
| 04 _ Statistic Criterion | NO_CRITERION |
| - 04 _ Value Criterion | 0 |
| 05 _ Statistic Criterion | NO_CRITERION |
| - 05 _ Value Criterion | 0 |
| ---------------------------------------------------------------------- ## | >>> ADDON PARAMETERS |
| Use Sound | true |
| Color Scheme | Green-Gray |
You can basically add any number of symbols and trading strategies having made their parameters external; the main thing to consider here is that the number of parameters shall be within the limit set by the developers (MetaQuotes) of the trading terminal (MetaTrader 5) which cannot exceed 1024 parameters.
Let us now have a detailed look at all the parameters of the EA:
| Description of the EA parameters | |
|---|---|
| Number Of Try | The number of repeated attempts if the trading operation failed. That is, the EA will retry to, e.g. open a position, at certain time intervals, if the previous attempt failed. This applies to all trading operations. |
| Slippage | Permissible price slippage. That is, if slippage occurs at the position opening, the operation will be canceled. This parameter is probably worth using if you trade on shorter time frames. |
| On/Off Trade | Enables (true)/Disables (false) trades for a specified symbol. |
| Name Symbol | The name of the symbol. The name shall be entered the same way as it was in the Market Watch window of the trading terminal. |
| On/Off Time Range | Enables (true)/Disables (false) trades in the specified time range. |
| Hour of the Start of Trade | The hour when trades can start. |
| Hour of the End of Trade | The hour until which trades are allowed. |
| Close Position in the End Day | Enables (true)/Disables (false) the mode in which a position will be closed at the end of the day. |
| Close Position in the End Week | Enables (true)/Disables (false) the mode in which a position will be closed at the end of the week. |
| Period PCH (total) | If the value set is greater than zero, it will be used as a common parameter for the indicator in all trading strategies of this symbol. |
| Timeframe (total) | If the value of Period PCH (total) is greater than zero, the value of this time frame will be used for the indicator. |
| Trade TS в„–01 | Enables (true)/Disables (false) trades with respect to this trading strategy. |
| Type Entry | Specifies the group of signals to be used in this trading block. |
| Period PCH (sub) | If the value of Period PCH (total) is zero, this value will be used for the indicator in this trading strategy. |
| Type Take Profit | Specifies the Take Profit type to be used in this trading strategy. There are two options in the current EA version: NO TAKE PROFIT and Points. That is, without using Take Profit and Take Profit set at the specified number of points. |
| Points TP | Specifies the distance in points for the Take Profit level in this trading strategy. |
| Type Stop Loss | There are two options in the current EA version: NO STOP LOSS and Points. That is, without using Stop Loss and Stop Loss set at the specified number of points. |
| Points SL | Specifies the distance in points for the Stop Loss level in this trading strategy. |
| Fix Lot | Fixed lot value. If the Money Management On/Off parameter is set to false, the traded lot volume is taken from this parameter. |
| Money Management On/Off | Enables (true)/disables (false) the Money Management System. If it is set to false, trades will be executed with a fixed lot the value of which is specified in the Fix Lot parameter. |
| Start Deposit | The starting point for the calculation of the traded lot in the Money Management System. |
| Delta | The value expressed as the amount of funds by which the account shall be increased/decreased, following which the traded lot volume will be increased/decreased. |
| Start Lot | The initial lot based on which the traded lot will further be increased/decreased. |
| Step Lot | The step of the lot. The value by which the traded lot will be increased/decreased. |
| Stop Trade | If the deposit goes down to this value, trades will stop. |
| Max Draw Down Equity (%) | If the deposit goes down to this value, trades will stop and the EA will be removed from the chart in the interests of safety. Following the removal, a relevant entry will be added to the log describing the reason of removal. This rule also applies when testing or optimizing parameters. |
| Stop Trade by Free Margin ($) | A calculation is made before a trade (purchase/sale) to see if it will result in the decrease of funds to the level below this value; if so, the trade will not be executed. |
| Stop Loss/Take Profit by Disconnect (p) | Real Stop Loss and Take Profit. They are set outside the current upper and lower trade levels. |
| Condition of Selection Criteria | There are two selection options: AND and OR . They are applied to criteria in the OPTIMIZATION REPORT parameter block to define how the optimization results will be selected to be written into a file. If AND is selected, all specified conditions shall be met. If OR is selected, at least one of the specified conditions shall be met. |
| Statistic Criterion | A drop-down list allows to select a parameter for generation of the condition to be used in filtering the optimization results written into a file.
|
| Value Criterion | The (limit) value on which the condition for filtering of the optimization results written into a file is based. For example, if you select Profit in the 01_Statistic Criterion parameter, and set 01_Value Criterion to 100, while selecting NO CRITERION in the remaining Statistic Criterion parameters, only those results will be written into a file of the optimization results the number of trades in which is more than 100. |
| Use Sound | Enables (true)/Disables (false) the system of sound notifications regarding trading operations. Each event/group of events has its own sound. Sounds are available for the following events:
|
| Color Schemes | The color scheme for the price chart. The color scheme for the chart can be selected from the drop-down list of eight available color schemes.
|
We should point out the events handled by the EA regarding the first parameter (Number Of Try).
Some of them are verified before the trade, some after the trade and others are verified both before and after, to be on the safe side.
- Failed to send trade request.
- Prices changed.
- Request rejected.
- Request rejected by the trader.
- Request processing error.
- Invalid request volume.
- Invalid request price.
- Invalid request stops.
- Invalid request.
- Trade is not allowed.
- Market is closed.
- Insufficient funds for request execution.
- Prices changed.
- Too many requests.
- Automated trading is not allowed by the server.
- Automated trading is not allowed by the client terminal.
- Request is blocked for processing.
- No connection to the trading server.
- Operation is allowed only for real accounts.
- Number of pending orders reached the limit.
- Volume of orders and positions for this symbol reached the limit.
I believe that this issue is also worth a separate article.
3. Parameter Optimization
The EA framework allows to prepare a variety of trade set-ups. Let us review two main variants using as an example the EA with a minimum configuration, i.e. 3 symbols, each of which contains 4 trading strategies.
Assign different values to the _ Name Symbol parameters (01,02,03). For example, EURUSD, AUDUSD, USDCHF. That is, these will be the traded currency pairs.
- Set the Period PCH (total) value greater than zero for all symbols thus communicating to the program that the period for the MultiSignals_PCH indicator will be common for all strategies within each symbol and the time frame value for the indicator will be taken from the Timeframe (total) parameter, i.e. it will also be common.
- Every strategy will have its own Type Entry parameter.
- The Stop Loss and Take Profit parameters are also set separately for every strategy.
All the above can be illustrated by a scheme below:
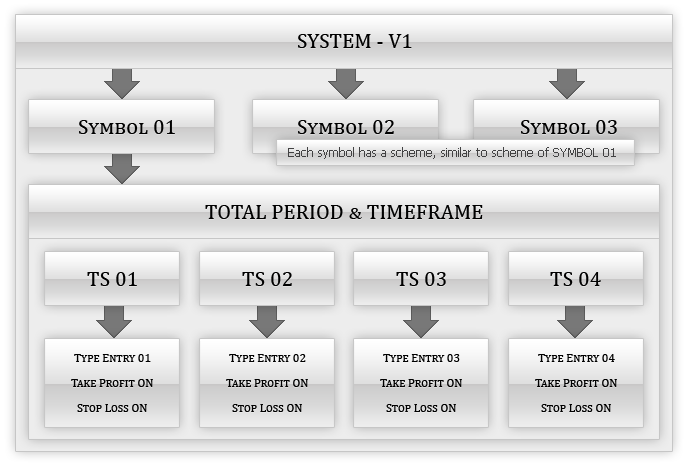
Fig. 8. Scheme of the first set-up variant
We should now set a step for the optimization of each parameter. As an example, set the values as provided in the table below. These values should be entered for all symbols and trading strategy blocks. Set 8 Hour as the Timeframe (total) parameter value. An in-depth information on the peculiarities of testing in the Opening prices only mode will be given in Tester Settings below.
It should also be noted that parameters shall be optimized having disabled the Money Management System, i.e. with a fixed lot (0.1). Money Management On/Off shall be set to false. Money Management System parameters shall be set separately, after all other parameters have been set.
| VARIABLE | START | STEP | STOP |
|---|---|---|---|
| Period PCH (total) | 5 | 1 | 30 |
| Points TP | 50 | 10 | 800 |
| Points SL | 50 | 10 | 200 |
Let us have a look at the following five points: General Parameters and Rules, Tester Settings, Analysis of the Obtained Results, BOOK REPORT Application and Money Management System. These five points apply to all set-up variants but a detailed review thereof will be provided only in this (first) variant description.
3.1.1. General Parameters and Rules
Set 50 as the Max Draw Down Equity (%) value. It will filter and stop passes whose maximal draw down in the course of optimization will appear to be less than 50%. It will also slightly increase the optimization speed without wasting time on passes of no "value".
Parameters shall be optimized separately for every symbol. This is a forced measure due to the fact that if the number of optimization passes exceeds the value of a 64 bit long, the optimization will be impossible due to the limit set by the developers of the trading terminal. Information on all constraints imposed can be found in the Help section of the trading terminal.
3.1.2. Strategy Tester Settings
In the Settings tab of the trading terminal Tester, set the parameters as shown below:

Fig. 9. Strategy Tester parameters
As an example, the testing period is set to be ~ 1 year long. You can set any symbol because regardless of the symbol on which the EA is running, trades will be executed for those symbols that are specified in the EA parameters.
Set Fast (genetic algorithm) as the optimization type.
In our example, we set Balance Max, i.e. maximum balance value, as the optimization criterion.
In the list of optimization/testing modes, select Opening prices only. It provides the lowest quality level but it is quite adequate for parameter optimization, provided that the EA only trades on completed bars. Following the optimization, it is advisable to further test the results in the higher quality mode. There is another important thing to have in mind.
Due to peculiarities of the Opening prices only internal mechanism, time frames should not be involved in the parameter optimization. This has to do with the fact that this mode does not allow you to obtain data from all time frames which will results in optimization/testing errors.
Further information on constraints can be found in Client Terminal - User Guide -> Strategy Tester -> Working with Tester -> Generation of Ticks (Section: Opening Prices Only). When optimizing parameters in the Opening prices only mode, you should also abide by the following rules:
- If the time frames for all symbols are different, each symbol should be optimized separately. That is, all other symbols should be disabled (FALSE).
- If the symbols have different time frames, once the optimization for all symbols has been completed, testing should be run in the OHLC mode on M1.
- If the optimization/testing only concerns one symbol, the time frame to be set in the Tester settings should be the shortest time frame used in TS or shorter than the shortest one.
If these rules are ignored, the OHLC mode on M1 would be optimal for parameter optimization. It would be useful to run tests in different modes and compare results.
The optimization run on a PC with a dual-core processor will take approximately 4-5 hours (as far as this set-up is concerned).
3.1.3. Analysis of the Obtained Results
Following the successive optimization of the parameters for every symbol, the overall optimization result should be analyzed in the Optimization chart tab in order to select the parameters that will further be involved in trading.
For example, the settings set forth above yielded the following results for EURUSD:
Fig. 10. Optimization results in the Tester's Optimization chart tab
The optimization chart suggests that the major part of the results is situated in the profit zone. The more results are displayed in the profit zone, the more certain you can be that the trading system will further return about the same result using particular parameters from the profit zone.
It should also be noted that the degree of certainty will be higher, the longer the testing period in combination with the criterion of the number of results in the profit zone. However, the longer the period, the more time the optimization will take. But in this case you can resort to the MQL5 Cloud Network provided by MetaQuotes. For a small fee, the optimization time can be reduced many times over due to a great number of processors involved in optimization. More information on this great feature can be found in the article Speed Up Calculations with the MQL5 Cloud Network. This option will also be quite handy if the optimization was decided to be run using the OHLC mode on M1.
If the optimization result obtained with respect to any particular symbol is for any reason not good enough, you should try to run the optimization for a different symbol. The criteria based on which you can determine what result can be considered acceptable, can be roughly as follows. For example, the maximal draw down shall not be more than 20 percent. With that said, the value of the recovery factor shall not be less than 2.00. The distance for the Stop Loss level shall be shorter than the distance for the Take Profit level, etc.
MetaTrader 5 offers a few tools to analyze the results. The optimization charts as described above are called Graphs with Results. In addition, there are Line (1D), Planar (2D) and Three-Dimensional (3D) graphs. Below are the testing results for USDCHF and EURUSD on Three-Dimensional (3D) graphs:
Fig. 11. USDCHF optimization results on the 3D graph
Fig. 12. EURUSD optimization results on the 3D graph
The three-dimensional graph clearly shows that there is quite a few parameter values for the MultiSignals_PCH indicator (green gentle profile area) coupled with different values of the Stop Loss level that are suitable for trading.
Once the parameters for each symbol have been selected, you should run a test having all the symbols together at the same time and analyze the result. The Graph tab in the Tester will show the result as illustrated in the first Figure below. The testing time in the Opening prices only mode is very short. A test over a period of 1 year will only take around 5 seconds to complete (see Figure below).
Fig. 13. Test results in the Opening prices only mode (first set-up variant)
Basically, the result will be the same if the Every tick mode is used.
It may be somewhat better or worse than in the Opening prices only mode however it is immaterial. In this particular case, it took around 12 minutes for the test to complete (see the Figure below).
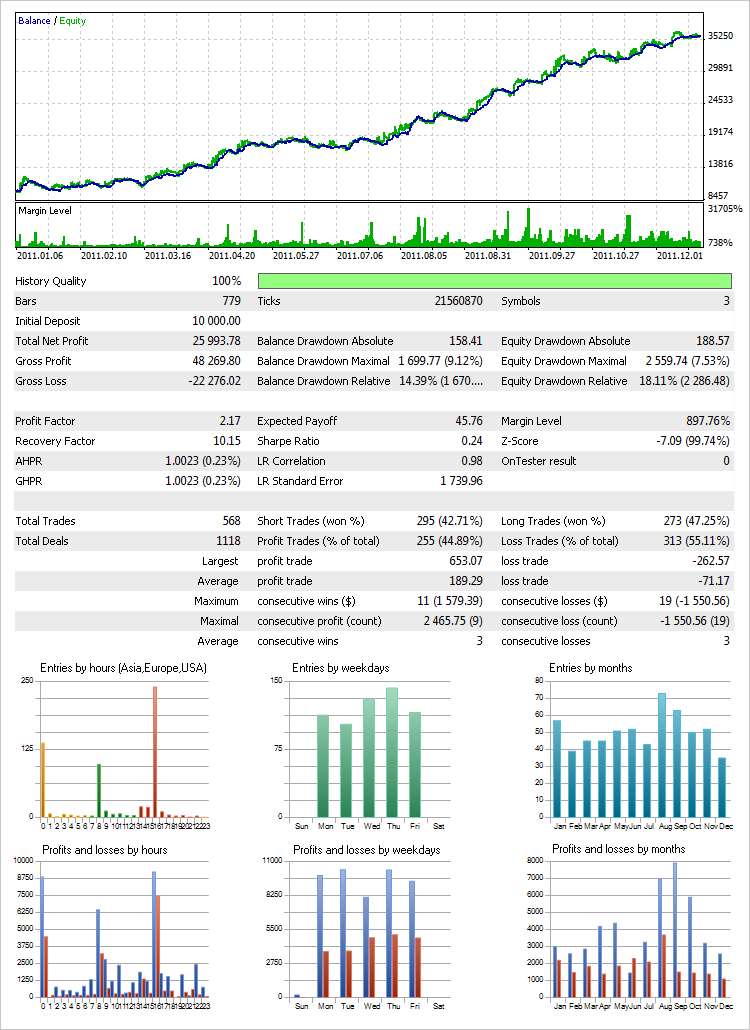
Fig. 14. Test result in the Every tick mode (first set-up variant)
The test lasted ~1 minute in the OHLC mode on M1.
3.1.4. BOOK REPORT Application for the Analysis of the Optimization and Testing Results
The BOOK REPORT application is provided as an addition to the EA. This application was developed using the VBA programming language. It is in fact a standard Excel workbook which only requires Excel 2010 installed on your PC in order to be used. Let us see into what the BOOK REPORT application has to offer.
The workbook has only one tab File which in turn offers to choose between three options: Recent, New and Print. This is all that remained of Excel. :) The rest was removed and the main steps for analyzing the obtained optimization and testing results were automated and simplified to the maximum.
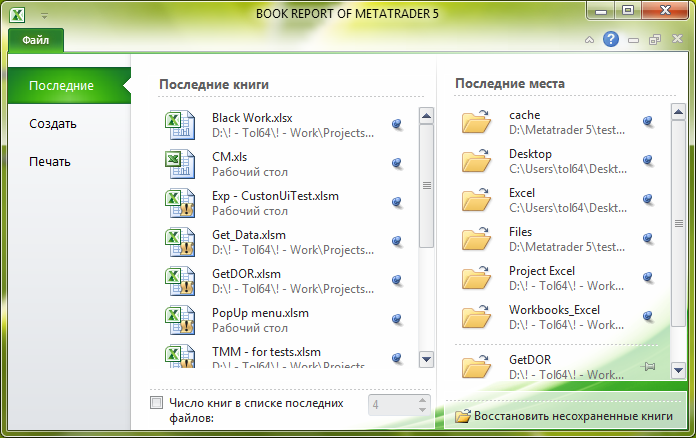
Fig. 15. BOOK REPORT application in Excel 2010
By default, the workbook already contains the optimization and testing data for the initial familiarization with the application.
This is illustrated in the Figure below:
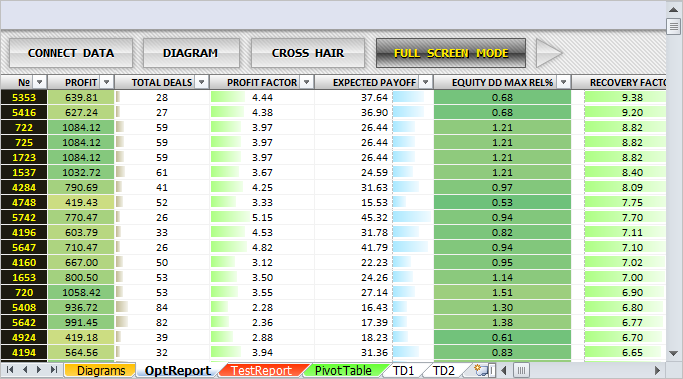
Fig. 16. Optimization result data
On top of the table in the OptReport worksheet, you can see the following buttons: CONNECT DATA, DIAGRAM, CROSS HAIR and FULL SCREEN MODE.
The FULL SCREEN MODE button is followed by the right arrow button allowing to quickly jump to the end of the table without the need to scroll down. The columns containing the parameter data that was involved in the optimization are situated at the end of the table; and you can also find a button allowing to quickly jump to the beginning of the table that is situated at the top, to the right of the table of data.
The data is filtered and can be sorted in descending or ascending order. Every column is formatted for easy reading of data displayed as horizontal bars or color scales. Let us now have a look at each button at the top of the table:
- CONNECT DATA. If you click on this button, a dialog box will appear asking to specify the import data file path. The BOOK REPORT application is trying to find a path to the common directory of the terminal.
For example, in Windows 7, it will be: C:\ProgramData\MetaQuotes\Terminal\Common\Files\
In Windows XP: C:\Documents and Settings\All Users\Application Data\MetaQuotes\Terminal\Common\Files\
If the path is not found, it can be specified by the user.(Following the first and subsequent optimizations of parameters of the Expert Advisor TRADING WAY) the DOR folder is created in the Files folder of the common directory of the terminal; the EA folder with the EA name is, in turn, created in the DOR folder followed by generation of OPTn folders in the EA folder (n is the number of an OPT folder). In the OPT folder, the EA generates DOR.csv that contains the optimization results. This is the file we need to import to the OptReport worksheet.
An attempt to open a file with a different name or extension will fail followed by a relevant warning displayed in a dialog box.
An attempt to open a file with a different data structure or a zero-length file will also result in a dialog box with a relevant warning. If the correct file was selected, the current OptReport data will be removed and replaced by the data from the file. The whole process takes just a few seconds.
- DIAGRAM. A click on this button will take you to the Diagrams worksheet. For example, if the data in the Profit column of the OptReport worksheet were sorted in descending order, the picture you will see will be more or less as follows:
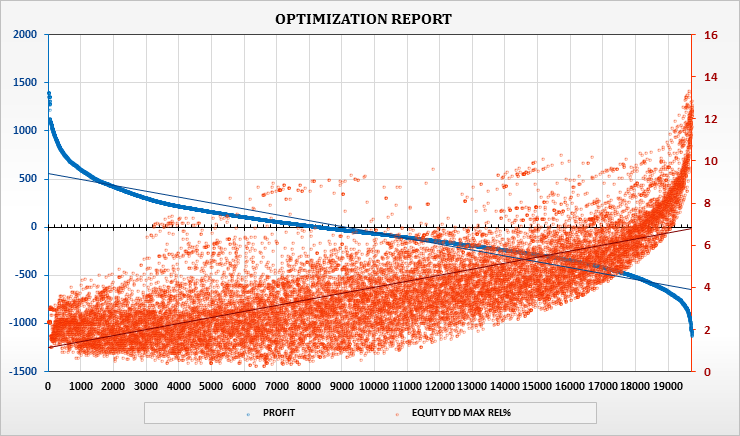
Fig. 17. Optimization result data in the chart
Below the chart, there is a table featuring description of all parameters appearing in the report. Parameter names in the left column of the table are links to relevant columns in the OptReport worksheet. A comprehensive list of the parameters is set forth below:
- PROFIT - Net profit at the end of testing;
- TOTAL DEALS - The number of executed trades;
- PROFIT FACTOR - The ratio of total winning to total losing trades;
- EXPECTED PAYOFF - The mathematical expectation of winning;
- EQUITY DD MAX REL% - Max. equity drawdown expressed as a percentage;
- RECOVERY FACTOR - The ratio of net profit to max. balance drawdown expressed as a monetary value;
- SHARPE RATIO - The ratio of arithmetic mean return for the period of holding a position to standard deviation from it;
- EQUITY DD - Max. equity drawdown expressed as a monetary value;
- EQUITY DD% - Equity drawdown expressed as a percentage recorded at the max. equity drawdown expressed as a monetary value;
- EQUITY DD RELATIVE - Equity drawdown expressed as a monetary value recorded at the max. equity drawdown expressed as a percentage;
- EQUITY MIN - Min. equity;
- BALANCE DD REL% - Max. balance drawdown expressed as a percentage;
- BALANCE DD - Max. balance drawdown expressed as a monetary value;
- BALANCE DD% - Max. balance drawdown expressed as a percentage recorded at the max. balance drawdown expressed as a monetary value;
- BALANCE RELATIVE - Balance drawdown expressed as a monetary value recorded at the max. balance drawdown expressed as a percentage;
- BALANCE MIN - Min. balance;
- MIN MARGIN LEVEL - Min. margin level value reached;
- GROSS LOSS - Total loss, the sum of all loss (losing) trades;
- GROSS PROFIT - Total profit, the sum of all profit (winning) trades;
- CONLOSS MAX - Max. loss in consecutive loss trades;
- CONPROFIT MAX - Max. profit in consecutive profit trades;
- MAX CONLOSSES - Total loss in the longest series of loss trades;
- MAX CONWINS - Total profit in the longest series of profit trades;
- MAX LOSS TRADE - Max. loss - the greatest value among all loss trades;
- MAX PROFIT TRADE - Max. profit - the greatest value among all profit trades;
- TRADES - The number of trades;
- SHORT TRADES - Short trades;
- LONG TRADES - Long trades;
- LOSS TRADES - Losing trades;
- PROFIT TRADES - Winning trades;
- PROFIT SHORT TRADES - Short profit trades;
- PROFIT LONG TRADES - Long profit trades;
- LOSS TRADES AVGCON - Average length of consecutive loss trades;
- PROFIT TRADES AVGCON - Average length of consecutive profit trades;
- CONLOSS MAX TRADES - The number of trades making the max. loss in consecutive loss trades;
- CONPROFIT MAX TRADES - The number of trades making the max. profit in consecutive profit trades;
- MAX CONLOSS TRADES - The number of trades in the longest series of loss trades;
- MAX CONPROFIT TRADES - The number of trades in the longest series of profit trades;
Above the chart, you can see the drop-down lists. The first list allows to select one of three charts:
- OPT.REPORT DIAGRAM is a diagram as shown above. It displays all optimization results written into the file. The chart has two axes so that the results can be viewed simultaneously by two parameters. When the diagram is active, the drop-down lists with all the parameters are shown above the diagram on the right.
Fig. 18. Drop-down lists displayed above the diagram of optimization results
A click on the diagram takes you to the worksheet with its data. In this case, to OptReport.
- PIVOT 3D DIAGRAM is a second diagram in the drop-down list. It is a three-dimensional pivot diagram.
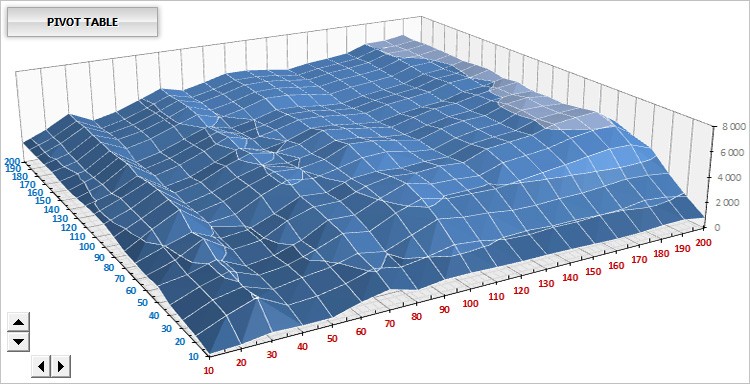
Fig. 19. Parameter combinations of optimization results displayed in the three-dimensional diagram
When this diagram is active, you can see the drop-down lists above it on the right, where you can select the parameters involved in the optimization (the first and third lists) and one of the key parameters (the second list) for the vertical axis.
Fig. 20. Drop-down lists above the three-dimensional diagram
Controls allowing to rotate the diagram around the horizontal and vertical axes are situated in the lower right part of the diagram. A click on the diagram will take you to the OptReport worksheet containing the main data but you can also choose to go to the pivot table based on which the diagram is plotted. The PIVOT TABLE button in the top left corner of the diagram takes you to the PivotTable worksheet featuring the pivot table.
The thing is that every point of this diagram reflects the cumulative result of all results with the ability to view parameter combinations. Therefore, it offers another handy feature for a more detailed analysis.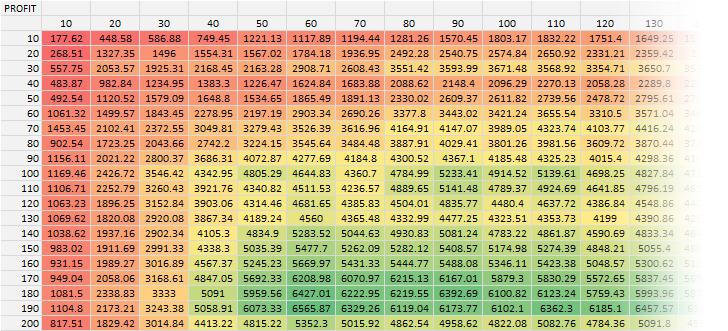
Fig. 21. Pivot table associated with the three-dimensional diagram
This feature consists in that having selected a cell containing the data of interest (the pivot table shown above), a TDn worksheet is generated (where n is the number of a worksheet with the TD label), where a formatted table will appear containing all results related to the parameters as selected in the pivot table. For example, if you select a cell with parameters 190 and 100, a table will be generated where all results match these parameters. See the Figure below: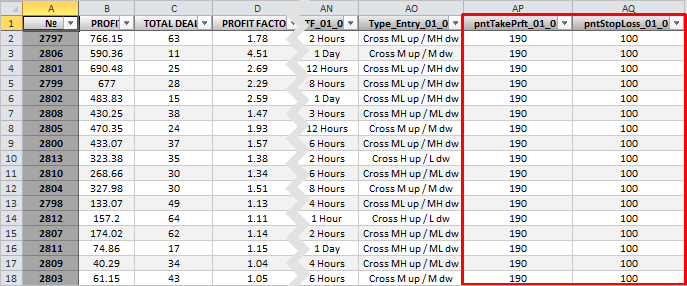
Fig. 22. Table of the optimization results selected in the pivot table of parameters
- TEST DIAGRAM is the third diagram that displays balance charts of all TS involved in testing:
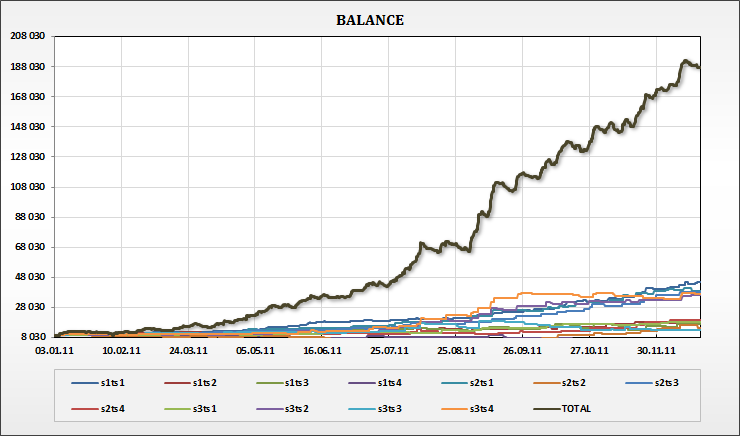
Fig. 23. Test result involving all TS in the system
After each test, all subsequent EA test results are placed into the TESTS folder created in the last created optimization folder OPTn . Each result is written into a separate file testN.csv, where N is the file number.
Test results can be loaded to be viewed in the TestReport worksheet. This worksheet has the same buttons on top of the table as OptReport. Thus, to load the data, click on the CONNECT DATA button. Apart from TS balance data, the files also contain a report similar to the one found in the Results tab of the trading terminal. For convenience of the analysis, the data is also formatted.
Fig. 24. Test results on trades
- CROSS HAIR. This button enables the crosshair function that is simple and convenient. The above Figure shows the CROSS HAIR button pressed.
- FULL SCREEN MODE. As mentioned earlier, this button enables/disables the full screen mode.
The BOOK REPORT application has a few safety measures against accidental deletion of objects. That is, you cannot select and consequently delete any object (buttons, diagrams, design elements).
All Excel context menus with numerous options that would never be used in this application were removed. At the moment, there are only two modified context menus.
- The context menu that appears when you right-click on the cells. It now has only two options: Copy and Microsoft Word.
- Worksheet context menu. The remaining options available are: Insert…, Tab Color and Delete.
The Delete option was reprogrammed so that the user cannot accidentally delete the main (utility) worksheets. An attempt to delete such a worksheet will result in a warning message and the deletion will be rejected.
3.1.5. Money Management System
After setting the parameters for all symbols and analyzing the obtained results, you should make settings for the Money Management System.
The Money Management concerns the account as a whole. According to the Fixed Ratio money management method proposed by Ryan Jones, before you can add a lot to an existing number of lots, each of the existing lots shall "win" a certain number of points (which Jones called the "delta"). For example, we have a deposit of 300 dollars and trade with 1 mini lot; the delta of, say, the same 300 dollars would mean that we will increase to 2 mini lots only when we gain (with the 1 mini lot we have) 300 dollars.
Similarly, the lots will be increased to 3 only after 2 mini lots will gain the delta of 300 dollars (each). That is, the increase from 2 to 3 mini lots will be possible when we add to the existing 600 dollars another 2 С… $300 = $600, i.e. when having $1200; from 3 to 4 mini lots with the deposit of $1200 + ($300 С… 3) = $1200 + $900 = $2100, etc. Thus, "the number of contracts is proportional to the amount required to buy a new number of contracts", from where the method derives its name. The decrease in the number of lots follows the same scheme in reverse.
We can, of course, run the parameter optimization but let us better have a look at the manual settings. For a pretest, you can use the Opening prices only mode or OHLC on M1.
The Money Management System default parameter values are as shown in the table below:
| PARAMETERS | VALUE |
|---|---|
| Start Deposit | 10000 |
| Delta | 300 |
| Start Lot | 0.1 |
| Step Lot | 0.01 |
After the test, the obtained result should be analyzed. The test result is shown in Figures below:
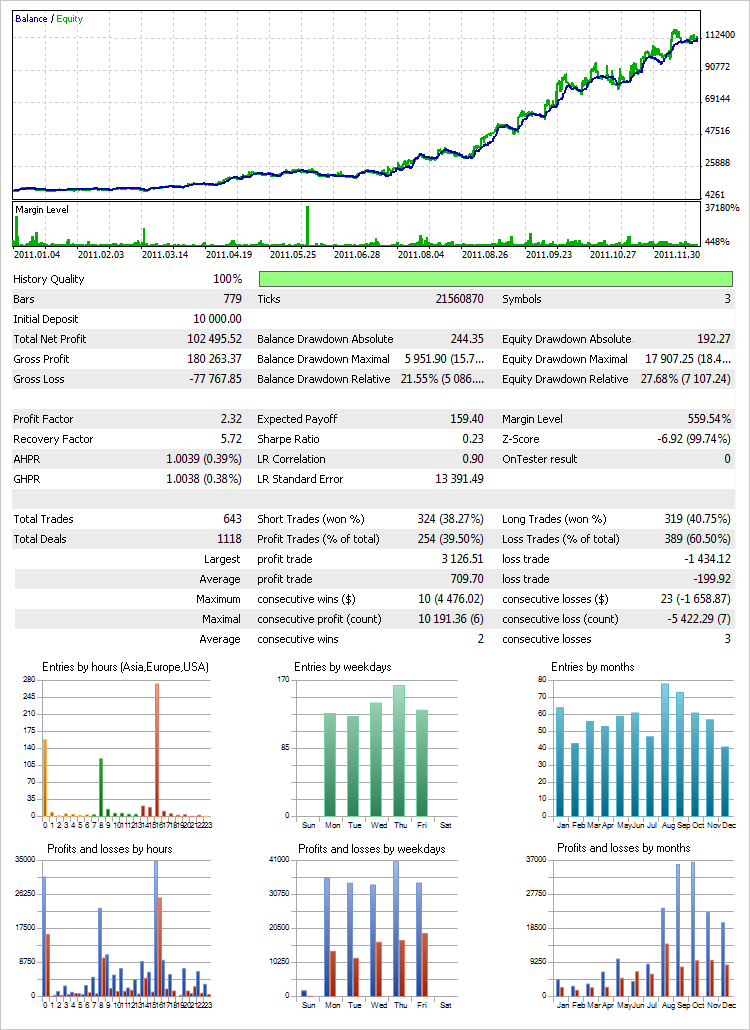
Fig. 25. Test result in the Every tick mode using the Money Management System (first set-up variant)
The total profit should not be paid much attention to in the obtained result as it will anyway be higher due to the Money Management System applied to the series of trades based on historical data with optimized parameters.
Parameters of greater importance are the Max. deposit drawdown relative to equity and the Min. margin level. The Money Management System in the EA has fairly flexible settings so that parameter values can be set to satisfy both conservative and aggressive trading. The Max. deposit drawdown and Min. margin level parameters are the ones that depend on traded volumes and the deposit involved in trading.
To better understand this or any other system, there is yet another important point to consider. The obtained result displayed above suggests that there was a series of successful trades at the very beginning but it does not show what drawdown there would have been if the trade had begun at the local maximum that subsequently transitioned to the max. drawdown. It is therefore also useful to set the initial date for a test from local maxima with the largest drawdowns and use those results as the basis to draw your final conclusion regarding the settings that would be appropriate for the Money Management System.
- In this variant, we will also assign different values to (01,02,03) _ Name Symbol. Let us run a test with the same symbols to be able to compare the results with the previous variant: EURUSD, AUDUSD, USDCHF.
- This time, set zero as the Period PCH (total) parameter value thus communicating to the program that the period for the MultiSignals_PCH indicator will be unique to all strategies. For this purpose the value will be taken from the Period PCH (sub) parameter that is found in every trading strategy block. It is possible to set for the indicator its own time frame, however in this variant, we will set the same value everywhere using the Timeframe (sub) parameter in every trading strategy block.
- Every strategy will have its own Type Entry parameter.
- The Stop Loss and Take Profit parameters are also set separately for every strategy.
Below is the scheme of the above:
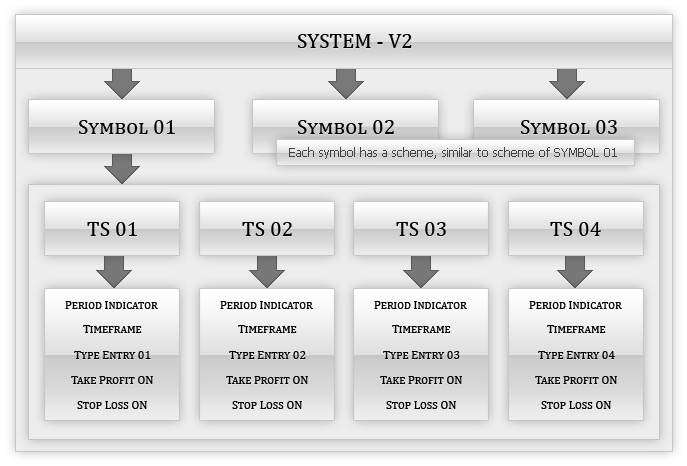
Fig. 26. Second Set-Up Variant
Let us set a step for the optimization of each parameter. As an example, set the values as provided in the table below. These values should be entered for all symbols and trading strategy blocks. The Timeframe (sub) parameter will be assigned a fixed value.
The Money Management System shall be disabled during the parameter optimization. That is, the Money Management On/Off parameter shall be set to false.
This (second) variant differs from the previous (first) one in that the period for the MultiSignals_PCH indicator will be picked out separately for each strategy and the optimization for all trading strategies will run one at a time. Every time, during the optimization of a certain strategy, all other strategies shall be disabled. Set the same time frame for all TS as in the previous test, i.e. 8 Hour.
| Parameter | Start | Step | Stop |
|---|---|---|---|
| Period PCH (sub) | 5 | 1 | 30 |
| Points TP | 50 | 10 | 800 |
| Points SL | 50 | 10 | 200 |
A detailed description of General Parameters and Rules, Tester Settings, Analysis of the Obtained Results, BOOK REPORT Application and Money Management System can be found in the first set-up variant. Only the test results will be provided here.
After each optimization, the parameters for every strategy were selected based on the maximum value of the recovery factor.
The cumulative result with a fixed lot (0.1) is shown below:
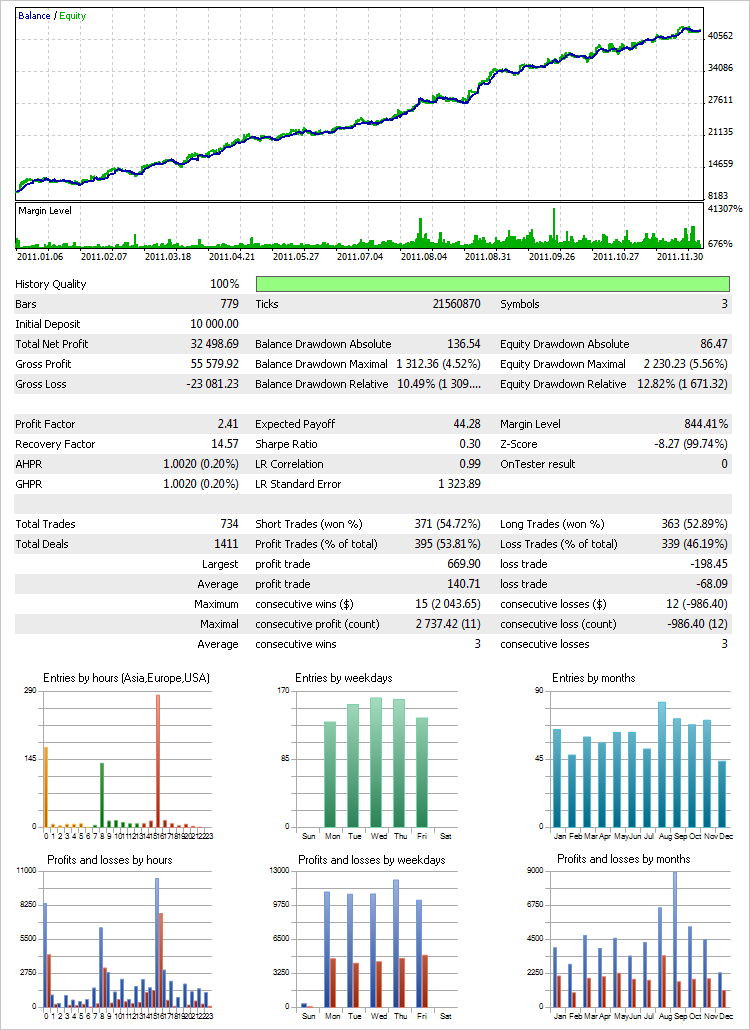
Fig. 27. Test result in the Every tick mode (second set-up variant)
Let us now apply the Money Management System as set in the first variant to these series of trades:
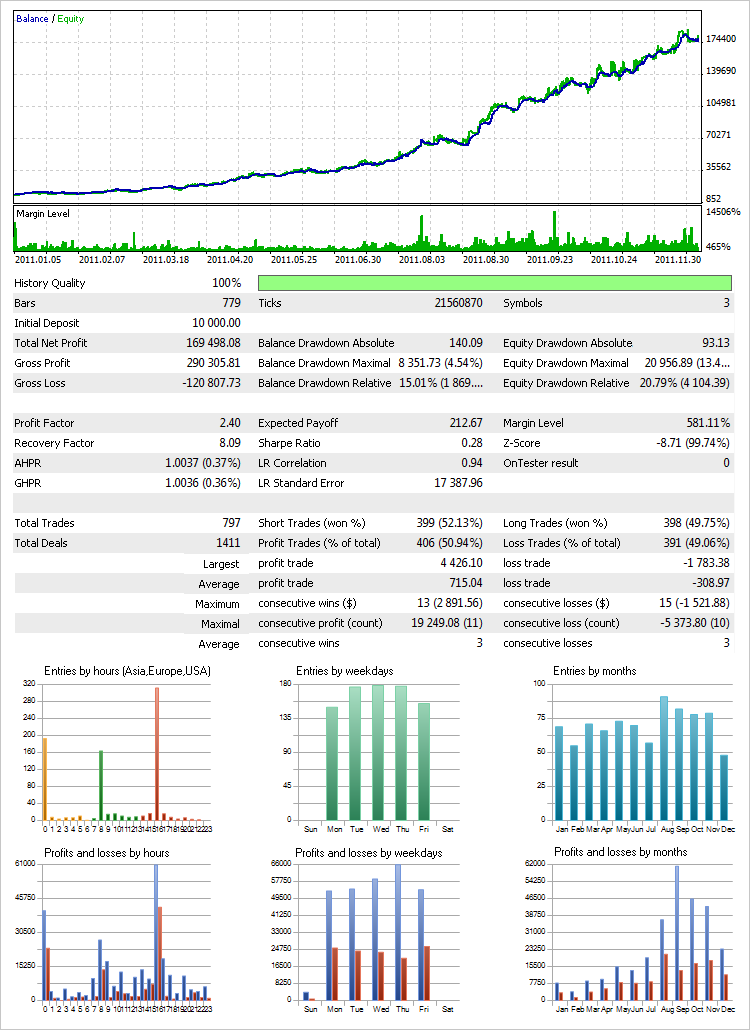
Fig. 28. Test result in the Every tick mode using the Money Management System (second set-up variant)
This variant allows to better understand and identify peculiarities of every group of signals as the attention is focused on every single element of the system. In other words, using the second variant, you can see the entire internal mechanism of the system and should the test reveal a weak point of any part thereof, you can try to change certain parameters or remove them altogether. This is the advantage offered by the second variant.
The EA is developed in such a way that it is not limited to the above variants only. For example, you can enter the name of one symbol in the _ Name Symbol (01,02,03) parameter and trade one symbol using twelve trading strategies. Parameters of trading strategies can in turn be set to use different time frames. Or one time frame but different indicator periods. The same applies to Stop Loss and Take Profit levels. If Take Profit or Stop Loss are disabled, the subposition will be closed based on a reversal signal or Stop Loss/Take Profit.
You can try to set the system without using Stop Loss/Take Profit levels thus simply making it reversal. In this case, the EA will resort to the following mechanism. The block of signals for opening and reversal of a position remains the same as described in Trading System Conditions above. It also covers closing of a position if the price is sliding into the loss-making zone. The list below sets forth exit signals in case there is no pending order of the Stop Loss type, in the same sequence as in the conditions for opening subpositions:
- Upcrossing of the level H_PCH for closing a subposition SELL / Downcrossing of the level L_PCH for closing a subposition BUY.
- Upcrossing of the level H_PCH for closing a subposition SELL / Downcrossing of the level L_PCH for closing a subposition BUY.
- Upcrossing of the level M_PCH for closing a subposition SELL / Downcrossing of the level M_PCH for closing a subposition BUY.
- Upcrossing of the level M_PCH for closing a subposition SELL / Downcrossing of the level M_PCH for closing a subposition BUY.
The first and second conditions are equal. The third and fourth conditions are equal. The testing on various time frames revealed that these are the more appropriate conditions for exit if there is no pending order of the Stop Loss type. Under this scheme, if a real Stop Loss is used as a "safety cushion" (Stop Loss/Take Profit by Disconnect (p) parameter), it is set at the number of points specified in this parameter, provided that there are no more pending orders associated with other subpositions.
If the price gets closer/moves away from the real Stop Loss by ВЅ of the specified number of points, provided that there are no more pending orders associated with other subpositions, the Stop Loss is modified. That is, it moves with the price by a specified number of points, when the price recedes, and moves away from the price when it approaches. Take Profit acts in the same manner if a pending order of the Take Profit type is not specified in the settings of a certain strategy. The principle of setting a "safety cushion" for the full mode was described in Trading System Conditions above.
Trading can be set for a specific time range separately for each symbol. It may well be that trading certain symbols is best at particular hours. There is also a possibility to close all positions at the end of the day or a week. Closing of a position at the end of a certain time interval is also available in semi-automated mode. This will be considered in more detail in the CLOCKS OF TRADING SESSIONS below.
In addition, you can simply optimize parameters for the indicator and trade manually using indicator signals. There sure are traders who, for one reason or another, prefer to trade manually and whose views and interests have also been taken into account. Manual trading in the EA is done through a convenient trading panel further information on which will be provided in Trade Information Panel on the Left Side of the Chart.
4. Testing in the Visualization Mode
The visualization mode available in the Strategy Tester is certainly worth being mentioned here.
This tool currently has some limitations but hopefully the developers will work on its further improvement. At the moment, despite the limitations, the visualization mode offers a more informative experience getting started with a certain program.
This approach is also useful when developing and debugging complex programs. The Figure below shows what tools can be added for the analysis of the current situation during testing:
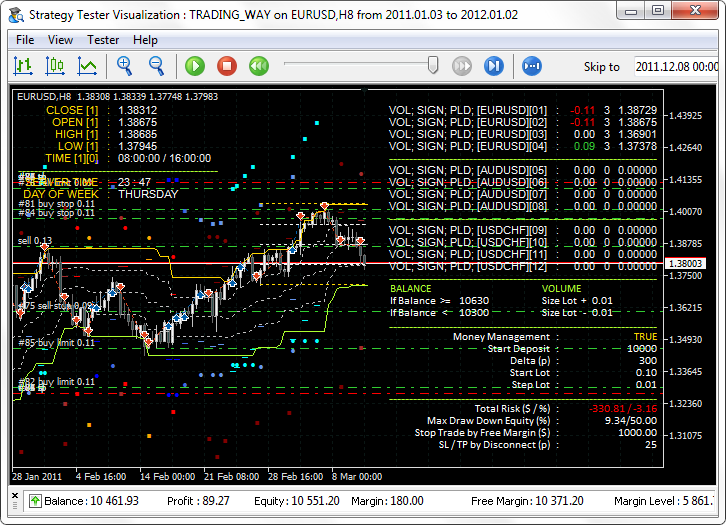
Fig. 29. Information panels in the visualization mode
The left side of the chart contains data on the last completed bar, current server time and day of the week. The right side of the chart provides a table of open subpositions for all symbols and strategies that displays subposition volumes, buy/sell signals and the price at which the last trade of a particular strategy was executed.
In the lower part, you can see the Money Management System parameters and the current lot volume, as well as the current drawdown, total risk, stop trade and SL/TP ("safety cushion") levels set. More information on these parameters will be provided in the next section Interface and Controls.
5. Interface and Controls
The first loading of the EA to the chart triggers generation of the terminal global variables that will further be used by the EA. There is quite a few of them (46). If you try to delete any of them or all at once, the EA will restore them with default values.
A trade information panel will appear on the right side of the chart and the color scheme as specified in the Color Schemes parameter will be applied to the latter. You can select any color scheme out of eight available ones (in light or dark colors).
Price indent from the right side of the chart is adjusted automatically when the EA is loaded to the chart or the chart width is modified, so that the price is not blotted out by the panel. It will look as shown in the Figure below:
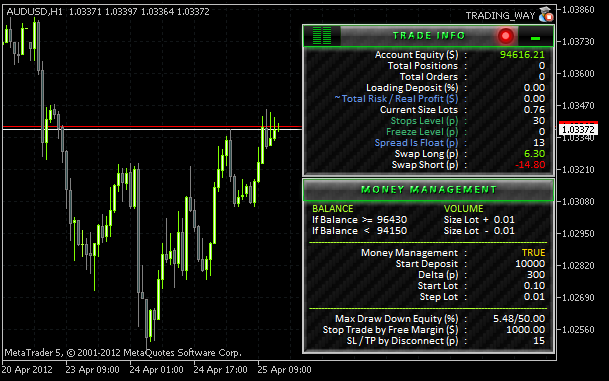
Fig. 30. The chart following the loading of the EA
6. Information Panels TRADE INFO and MONEY MANAGEMENT
The trade information panel situated on the right side of the chart consists of two blocks: Trade Info and Money Management. On the left and on the right of the block name, in the upper part of the Trade Info block, you can see the following icons (listed from left to right): Left Panel, Warning Indicator and Hide All Panels. When you hover the cursor over an icon, a tooltip appears and the icon changes in appearance (the green color is replaced by the ambient white color).
A click on the Left Panel icon opens a trading panel in the left side of the chart which will be described later on. Together with the opening of the trading panel, a Left Panel Down/Left Panel Up icon will appear next to the Left Panel icon. It depicts a triangle arrow showing the direction in which the panel will move following the click on the icon.
If there is nothing that would hinder the trade, the Warning Indicator icon is green (the green light). If something blocks the trade, the Warning Indicator icon takes red color (the red light). The red light may be caused by the reasons listed below:
- No connection to the server.
- The Expert Advisor is not allowed to trade.
- The terminal is not allowed to trade.
- Trade is not allowed for the current account.
- Trade using Expert Advisors is not allowed for the current account.
If you click on the Warning Indicator icon while the light is red, a message will appear on the left side of the chart stating the reason why trading is blocked. The Figure below illustrates the event when the Expert Advisor is currently not allowed to trade (terminal option). The message can be removed by clicking on the Warning Indicator icon.
The appearance of your panels can be enhanced by such effects as adding a drop shadow to a panel or any other effect, in any graphics editor using an alpha channel.
Fig. 31. Message stating the reason why trading is blocked
A click on the Hide All Panels icon minimizes all open panels leaving the SHOW button in the bottom right corner of the chart active which can be afterwards clicked on to quickly maximize the workspace customized earlier:
Fig. 32. SHOW button
The Trade Info panel features a list of some trading parameters. Those that contain a function are displayed in MediumSeaGreen color. That is, if you click on the name of the parameter, the function it contains will be performed and the name will turn blue. And vice versa, if the blue name is clicked, everything takes its initial form.
The table below provides a detailed description of the Trade Info panel parameters and their functions:
| List of the TRADE INFO panel parameters | |
|---|---|
| Account Equity ($) | Current equity level. If it is higher than the balance, the value is displayed in green. If it is lower than the balance, the value is displayed in red. |
| Total Positions | Number of positions at the current time. |
| Total Orders | The number of pending orders at the current time. |
| Loading Deposit (%) | The amount of equity used in the trades, expressed as a percentage. |
| ~Total Risk/Real Profit (%) | Total risk of the deposit/Real profit. This is a calculated amount of equity that can be lost in the worst case scenario. The value is approximate since the pending orders between the position opening price and the real Stop Loss level are not taken into account. If the calculation was made with due consideration of the pending orders, the risk would be lower as the trading system places pending orders between the opening price and the Stop Loss level acting as protective levels of other subpositions. If real Stop Loss appears to be higher than the opening price, the parameter indicates a real protected profit and is displayed in green. By default, it is expressed as a percentage. If you click on the name, the parameter will be displayed as a monetary value and its name will turn blue. A click on the blue name will restore everything into its initial form. |
| Current Size Lots | Current traded lot size used in automated trading mode. |
| Stops Level (p) | It shows the Stop Level value on the current symbol, expressed in points. If you click on the name, its color will change and horizontal dash-and-dot lines representing levels of Stops Level will appear in the chart. The levels move together with the price. |
| Freeze Level (p) | It shows the Freeze Level value for the current symbol, expressed in points. |
| Spread Is Float (p) | It shows the spread value on the current instrument. If the spread is floating, Spread Is Float will be displayed, otherwise just Spread. By clicking on the name, the Ask line will be added to/removed from the chart. |
| Swap Long (p) | Long position swap of the current symbol. |
| Swap Short (p) | Short position swap of the current symbol. |
Parameters of the Money Management block are easier described without using the table. The Money Management block is divided into three parts. The upper part contains two columns: BALANCE and VOLUME. The BALANCE column displays balance levels at which the traded lot volume will be increased or decreased, if the Money Management System is enabled (true). The VOLUME column displays the volume by which the lot will be increased/decreased. If the system has dropped to the minimum lot, a message in red will replace the volume, e.g.: Not Less Than 0.01. If the Money Management System is disabled (false), all values in this part of the block will be zero.
The Money Management System parameters are displayed in the central part of the Money Management block. The description of the parameters was given above in the table Description of the EA parameters. Values of these parameters do not change in the course of trading and can only be changed in the external parameters of the EA.
In the lower part of the Money Management block, you can see parameters related to risk management. Their description can also be found in the table Description of the EA parameters above. We should note here that the right part of the Max Draw Down Equity (%) value after the slash is the set limit while the left part before the slash reflects the current account drawdown relative to equity.
Once the set account drawdown limit is reached, all open positions get closed and pending orders, if any, are removed. When the drawdown limit is reached, the parameter value is displayed in red. For example: ! 22.01/20.00 ! . This means that the drawdown limit was set at 20% while the current drawdown is already 22%.
The Stop Trade by Free Margin ($) value also takes red color if after the purchase/sale, the available funds indicated in the Current Size Lots parameter in the Trade Info block turn out to be smaller than or equal to the set value. For example: ! 5000 ! . The EA will not execute trades till the funds are sufficient for execution of these trading operations.
The value of the last parameter in the list, SL/TP by Disconnect (p), shows either the number of points set in the EA or the text FALSE which means that this parameter is disabled if it is set to zero in the EA. If the parameter is set to zero, positions will be opened without real Stop Loss and Take Profit.
With that said, if no Stop Loss is set for a position, the ~Total Risk/Real Profit (%) value in the Trade Info block will have ! 100.00 ! suggesting that the entire deposit is at risk (100%). If the parameter is set to display a monetary value, i.e. ~Total Risk/Real Profit ($), the value will show the current equity level. For example: ! 7698.54 ! .
7. Trade Information Panel on the Left Side of the Chart
Now, let us have a look at the trade information panel that appears on the left side of the chart once the Left Panel icon is clicked on the Trade Info block. There are five icons on the left of the panel title that can be used to move to another panel unit.
- Parameters System.
- Clocks Of Trading Sessions.
- Manual Trading.
- Trading Performance.
- Account/Symbols Info.
We will go through every one of them in detail.
When you have Parameters System enabled, the panel looks as shown below:

Fig. 33. PARAMETERS SYSTEM
The table displayed consists of seven columns. Column headings that do not contain any functions are displayed in yellow. Column headings that contain functions are displayed in MediumSeaGreen color.
If a certain symbol is not allowed to be traded, the entire trading strategy block will be displayed in gray. If a certain symbol is allowed to be traded while certain trading strategies are not allowed to be used in trades, only the strategies that are not allowed to be used in trading will take gray color.
- SYMBOLS. The first column contains the names of symbols traded by the EA. Since every symbol can be traded using four groups of signals/strategies, the table is arranged so that it is intuitive and easy to use. That is, dashes under the symbols mean that a certain strategy is associated with the symbol indicated above. A click on the symbol name takes you to the same name symbol. The time frame appearing first for a given symbol, i.e. in the same line, will be set by default. The current symbol turns blue. The whole trading strategy block related to a given symbol is highlighted. It can clearly be seen in the above Figure (the current symbol is AUDUSD).
SHOW ORDERS. The second column shows what strategies were used when opening subpositions, their volumes and direction. If there are no subpositions, you will see EMPTY displayed. If there is an open subposition, its volume will be shown. The direction is identified by the color. The volume for long positions (Long) is shown in green (e.g.: 0.05), for short positions (Short) in red (e.g.: 0.02). This column also features checkboxes that can be checked to see what pending orders are associated with a certain subposition. After checking the box corresponding to a certain subposition, solid horizontal lines will appear under the respective pending orders and the entry point of this subposition will be displayed as a vertical dash-and-dot line of the same color. You can check all boxes at the same time. The lines are difficult to be mixed up as every group of orders has its own color. See the Figure on the right.
The checkboxes are not cleared when you move to another symbol. Once you go back, the lines reappear on the chart, provided that the boxes had been checked before. Should a certain position get closed, the lines related to this subposition are removed by the EA from the chart and the checkbox is cleared and blanked off. The heading of this column is clickable. That is, if there is no checked box, the name will be displayed in MediumSeaGreen color. If there is at least one checked box, the name will take blue color.- TYPE SIGNAL/TRADING STRATEGY. The third column shows what signals/trading strategies have been selected in the EA parameters. If you click on a signal name, an indicator will be applied to the chart based on which trading signals for a certain strategy are generated and the name will be displayed in blue. If you click on another signal name when a certain indicator was already applied to the chart, that indicator will be replaced by the one that has been clicked. In the chart, you will see the symbol and time frame required for application of a certain indicator to the chart.
- TIMEFRAME. This column (the fourth one) displays time frames over which trading signals of a certain strategy are formed. A click on a time frame name takes you to that specific time frame and the time frame name takes blue color. All names with the same time frame in the current block/symbol will also become blue. If you click the time frame name situated in another block/symbol, the current symbol will also be changed. If an indicator was applied to the chart when a time frame name was clicked, the indicator will change to match the symbol, time frame and strategy.
- PERIOD INDICATOR. The fifth column shows indicator periods set in the external parameters of the EA. If an indicator is applied to the chart, the period will be displayed in blue. You can see checkboxes next to periods. If you check the boxes corresponding to the time frames and symbols that are currently required for the analysis and then click the column heading, a subwindow will appear at the bottom of the chart displaying multiple charts of those symbols and time frames as selected. The heading will be displayed in blue. If an indicator was applied to the chart, respective indicators will also be applied to all subwindow charts. If a certain indicator is removed by clicking on the signal name in the TYPE SIGNAL/TRADING STRATEGY column, the indicators will also be removed from all subwindow charts. The same is true when you want to apply an indicator. By checking/unchecking boxes while the column heading is blue, the respective charts will be added to/removed from the subwindow. The subwindow can be minimized if you click on the heading while it is blue. In fact, it will be deleted but all checkboxes will remain intact and you will be able to easily restore the workspace at any moment. The subwindow size is not fixed; you can change its height by manually dragging the top border as in the great majority of indicators that are displayed in subwindows. If the subwindow or the program window is resized, the position of subwindow charts will be adjusted so that they always fit in the subwindow without overlapping each other. If all boxes are checked at the same time, the subwindow will consequently display all charts. A click on a subwindow chart will take you to the symbol/time frame in the main window shown in a subwindow chart. If you zoom in/out on the chart by pressing +/- keys, the scale of all subwindow charts will also be changed accordingly.
To comfortably work with the EA, you should have at least a 15” monitor.
An instrument, time frame and parameters of the indicator should be specified upon receipt of the indicator handle. Since the display of all signals is set in the external parameters of the indicator, depending on what signals were selected in the EA settings, we specify the respective settings upon receipt of the handles thus getting the possibility to observe in subwindow charts only those signals that are used in a certain strategy.
Fig. 35. Multiple charts in the subwindow
- TAKE PROFIT. The sixth column displays the Take Profit values set in the external parameters of the EA. If a certain parameter block of a strategy requires that Take Profit is not used (NO TAKE PROFIT), the corresponding text will appear in the table of the Parameters System panel, i.e., NO TP.
- STOP LOSS. The seventh column displays the Stop Loss values. It is displayed based on the same principle as described in Take Profit. If no Stop Loss is set, NO SL will be stated in the table.
7.2. CLOCKS OF TRADING SESSIONS
When moving to Clocks Of Trading Sessions, the panel changes in appearance as shown below:

Fig. 36. CLOCKS OF TRADING SESSIONS
Here, you can see time parameter values set in the external parameters of the EA. A brief description of these parameters can be found in the table Description of the EA parameters. It should be noted that the highest priority is assigned to the ON/OFF TIME RANGE option for trading within the set time range. That is, if all time options for a certain symbol are enabled, the EA will be guided by ON/OFF TIME RANGE.
All positions at the end of this time range will be closed and pending orders associated with the closed subpositions will be removed. The next option in the order of priority is CLOSE IN THE END DAY intended for closing of positions at the end of the day. The EA will trade based on this option if both options for closing positions at the end of the day and at the end of the week (CLOSE IN THE END WEEK) are enabled at the same time. Positions will be closed at the end of the week only if the ON/OFF TIME RANGE and CLOSE IN THE END DAY parameters are set to FALSE. These features are available both in automated and semi-automated modes of the EA.
Using the time range mode, you can set the time to start trading (START TRADE) both later (in hours) and earlier than the time when all trades will stop (END TRADE) and all positions will be closed. That is, if the START TRADE value is 10 : 00 and END TRADE is 23 : 00, the EA will start looking out for signals for a certain symbol at 10 AM and if a position will remain open until 23 : 00 , it will be closed at 11 PM and all pending orders will be removed.
The EA will take no further attempts to open a position for this symbol till 10 AM. If the trade start time is set at 22 : 00 and the end time is set at 16 : 00, the EA will start trading at 22 : 00 of the current day and finish at 16 : 00 of the next day.
Fig. 37. Time scale in case the first value is greater than the second
In the lower part of the Clocks Of Trading Sessions panel, you can see the current Greenwich mean time (GMT), local time and server time. If there is no connection to the server, red dashes will be displayed instead of server time: -- : -- : -- .
The current symbol in the chart can be changed by clicking on the symbol name in the SYMBOLS column. The time frame value will be taken from the strategy listed first for a certain symbol.
Manual Trading is intended for manual and semi-automated trading and is divided into several sections that you can switch between by clicking on their names in the OPERATION WITH POSITION & ORDERS column:
- Buy/Sell/Reverse.
- Close Positions.
- Set Pending Orders.
- Modify Orders/Positions
- Delete Pending Orders.
7.3.1. BUY/SELL/REVERSE Section
Manual Trading with the Buy/Sell/Reverse section enabled is shown below:

Fig. 38. MANUAL TRADING; BUY/SELL/REVERSE section
Options (buttons) available in this section serve to buy, sell and reverse a position for the current symbol. Below the options, you can see the box for inputting Stop Loss (SL), Take Profit (TP) and Lot (LT) values. If you input zero values in the SL/TP boxes and attempt to buy/sell, the position will be opened without Stop Loss/Take Profit. The zero value can quickly be entered by simply clicking on the name corresponding to a certain input box. If you click on the input box name LT , the minimum possible lot for that instrument will be set.
A click on one of the buttons enables the standby and adjustment mode. The color of the button will change (it will become much darker) and if the SL/TP values are not zero, horizontal levels will appear in the chart corresponding to the price levels where Stop Loss/Take Profit will be set. The START button will appear in the top right corner of the panel (this rule applies to the options of all sections). A trading operation is executed using this button. The procedure will be dealt with in more detail later on, after the description of other panel options as they are somewhat interrelated.
Auxiliary options are situated in the lower part of the Buy/Sell/Reverse section:
- Follow The Price: this option has two variants to choose from - to either adjust the set levels or to adjust values in input boxes relative to the levels.
- Levels. If this variant is selected, the horizontal levels according to which Stop Loss/Take Profit will be set, will follow the price in order to always keep the distance specified in input boxes.
- Value Edits. If this variant is selected, the horizontal lines will not move, however depending on the distance from the price to the levels, if any is set, the values entered in the input boxes will be adjusted.
- Set Range Orders. This option is designed for a situation where you need to see in the chart all trading and horizontal levels based on which orders will be placed, without having to use the manual adjustment of the vertical price scale. The adjustments are made in one click. The maximum and minimum of the price chart are set as follows: the highest level plus 5 points, the lowest level minus 5 points, respectively . If there is a subwindow with multiple charts that show that there are open positions and/or pending orders for certain symbols, the vertical scale adjustment will apply to those, too.
- TP/SL As Position. This option helps to automate the process of setting and modifying Stop Loss/Take Profit for pending orders. That is, if a pending order is being set while there is an open position for this symbol with set Stop Loss and/or Take Profit, Stop Loss/Take Profit for the pending order will be set at the same levels as for the position. If you check the box, Stop Loss/Take Profit levels will be set even if they were not specified in the request. In other words, you do not need to spend time on adjustments where prompt execution of trades is required. MetaTrader 5 offers a standard tool for modification of pending orders/Stop Loss/Take Profit by simply dragging the levels with a mouse. This tool can be enabled/disabled in the Terminal settings -> Charts tab -> Dragging of trade levels. If it is enabled along with the TP/SL As Position option of the EA, the EA will also watch for modification of pending orders/Stop Loss/Take Profit. That is, when simply dragging a certain trading level, the EA will in all cases adjust the Stop Loss and Take Profit levels of all pending orders.
- Names Levels. This is a simple option to set the mode for displaying names and price values of horizontal levels.
Let us have a look at a situation illustrated in the price chart below and at the same time review the modification of horizontal levels prior to executing a trade, e.g. BUY with Stop Loss and Take Profit levels.
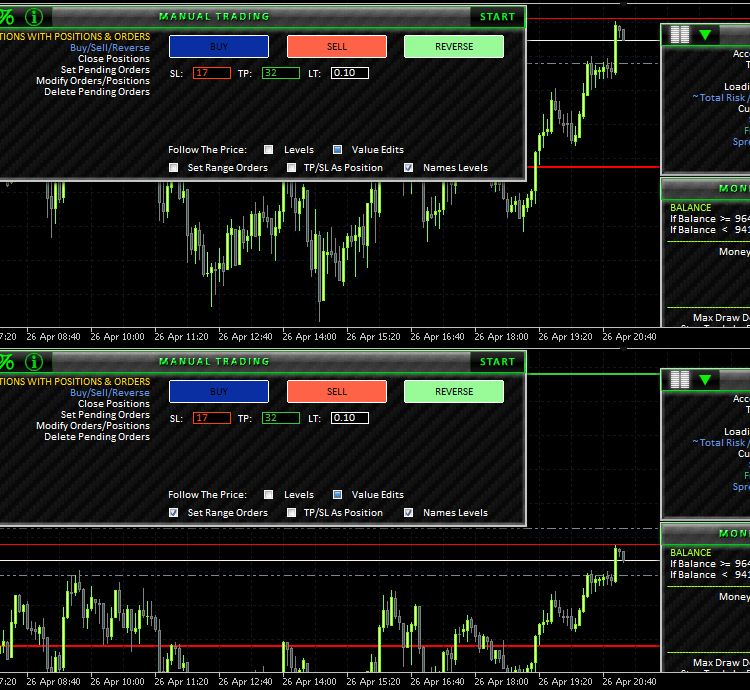
Fig. 39. Illustrated use of Set Range Orders
The above Figure (animated) shows that the BUY button is pressed (it has become much darker and the START button has appeared in the top right corner). You can now see horizontal lines in the chart: the red line - Stop Loss and the green line - Take Profit. If the Set Range Orders option is disabled, the Take Profit level is not visible in the chart (the line has appeared but it is beyond the visibility of the window). If you enable Set Range Orders, the chart height will be adjusted so that all levels are visible.
By dragging the horizontal levels, the values in the input boxes and the chart height relative to the levels are adjusted automatically, if the Set Range Orders option is enabled. The levels can also be changed by inputting values in the input boxes. If you try to set a horizontal line inside the levels of Stop Level, the EA will push it out of these levels (this rule applies to all sections). You only need to press START and a position will be opened, provided that there is no other hindrance, and the START button will be afterwards removed.
The above example concerns situations when there is no position for the current symbol. The REVERSE button is in this case unavailable. Or rather, if you click on it, you will hear an error sound, the button will not be pressed and the START button will not appear. If however there is already an open position, the REVERSE button is designed to reverse the position in the same volume, keeping the same Stop Loss and Take Profit levels, if any.
The BUY and SELL buttons can also be used to increase/decrease the current position volume while simultaneously modifying the position by adding Stop Loss/Take Profit levels if they were not set before. You can also close or reverse a position using these buttons. There may actually be a variety of possible combinations of trading operations.
7.3.2. CLOSE POSITIONS Section

Fig. 40. MANUAL TRADING; CLOSE POSITIONS section
Close Positions section available under Manual Trading contains options for closing of positions:
- ALL ONLY PROFIT closes all positions that are currently winning.
- ALL ONLY LOSS closes all positions that are currently losing.
- ON ALL SYMBOLS closes positions for all symbols.
- ON CURRENT SYMBOL closes a position only for the current symbol.
7.3.3. SET PENDING ORDERS Section

Fig. 41. MANUAL TRADING; SET PENDING ORDERS section
Options of this section allow for working with pending orders. Like in the Buy/Sell/Reverse section, there are input boxes for Stop Loss (SL), Take Profit (TP) and Lot (LT). In addition, there are input boxes:
- For a Pending Order (PO).
- For a level that, once reached, will trigger the setting of a pending order of the BUY STOP LIMIT/SELL STOP LIMIT type Execution Price (EP).
- For simultaneous setting of a group of pending orders (+PO).
- For spacing (SPACE) between orders when set as a group (SP).
The main modification rules were set forth in the description of the Buy/Sell/Reverse section. It should further be noted that the EA will not allow to set trading levels incorrectly. They will always be adjusted in any attempt to set them the wrong way, according to the trading rules.
An example of setting a group of pending orders is given in the Figure below.
Note that the value entered in the input box (+PO) is 12 but the EA adjusts the number in the chart, should a Take Profit level be set. When dragging the Take Profit level, the number of order levels in the chart will be changing.
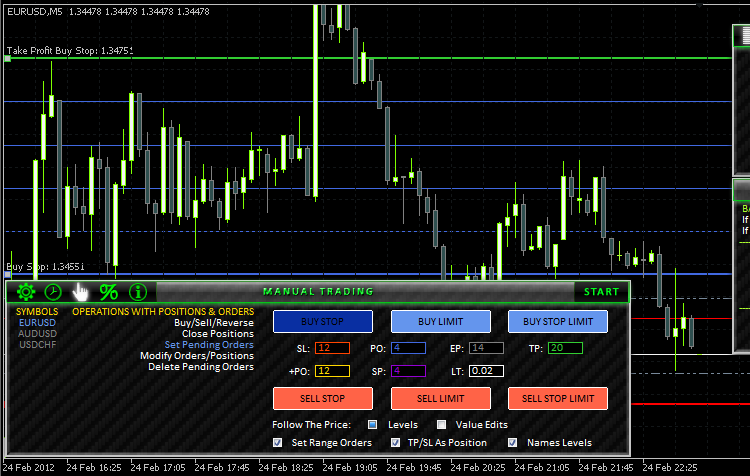
Fig. 42. Setting the specified number of pending orders
7.3.4. MODIFY ORDERS/POSITIONS Section
This section contains options that help quickly modify the positions opened earlier. It is as shown in the Figure below:

Fig. 43. MANUAL TRADING; MODIFY ORDERS/POSITIONS section
If no Stop Loss/Take Profit levels are set for an existing position, they can be set using the TAKE PROFIT/STOP LOSS options. If a position already has Stop Loss/Take Profit levels, they can easily be modified using the horizontal lines that appear when the corresponding buttons are pressed.
Using SET STOPLOSS TO BREAKEVEN, you can modify the positions whose profit is greater than or equal to the number of points specified in the input box IF PROFIT >= .
7.3.5. DELETE PENDING ORDERS Section
In the Delete Pending Orders section, you can find options for a quick deletion of pending orders.

Fig. 44. MANUAL TRADING; DELETE PENDING ORDERS section
- ALL ON ALL SYMBOLS Deletes all pending orders for all symbols;
- ALL ON CURRENT SYMBOL (CS) Deletes all pending orders for the current symbol;
- BUY STOPs (CS) Deletes all pending orders of the Buy Stop type for the current symbol (CS current symbol);
- BUY STOP LIMITs (CS) Deletes all pending orders of the Buy Stop Limit type for the current symbol;
- BUY LIMITs (CS) - Deletes all pending orders of the Buy Limit type for the current symbol;
- SELL STOPs (CS) - Deletes all pending orders of the Sell Stop type for the current symbol;
- SELL STOP LIMITs (CS) - Deletes all pending orders of the Sell Stop Limit type for the current symbol;
- SELL LIMITs (CS) - Deletes all pending orders of the Sell Limit type for the current symbol.
The Trading Performance section is shown in the Figure below:

Fig. 45. TRADING PERFORMANCE
This section contains a table of seven columns. The first column, SYMBOLS , is the same as in other sections. Other columns require a more detailed description:
- R & RP (%) This column displays the open position risk expressed as a percentage separately for each symbol. If the Stop Loss level of a position is modified and appears to be higher than the position opening price, the value is displayed in green, otherwise, in red. If no Stop Loss level has been set for a position, a warning sign appears: ! ! ! .
- R & RP (p/$) This column also shows position risk separately for each symbol. The heading of this column is clickable. If the heading is pressed, it is displayed in blue and the values are expressed in points - R & RP (p). If it is not pressed, they are shown as a monetary value - R & RP ($). The value color depends on whether the profit is protected. If no Stop Loss has been set for a position, a warning sign appears: ! ! ! .
- PROFIT n DAYS ($) Values of this column show profit over a specified number of days. The heading is clickable; once you click on it, an input box will appear in the top right corner of the panel and the heading will turn blue. Profit for every symbol separately will be shown over the number of days to be specified in the input box. The same value will afterwards be displayed in the heading. The value color depends on profit/loss over a specified number of days.
- MARGIN ($) Values in this column show the size of the margin used for each position.
- TICK LOSS/PROFIT ($) This column displays the tick value in a losing/winning trade.
- MARGIN CHECK BUY/SELL ($) In this column, you can see the equity volume required to execute a Buy/Sell trade. The heading is clickable. By clicking on it, you can create an input box in the top right corner of the panel with the value of the last specified volume. If a new value is input, all values in the column will be recalculated.

Fig. 46. ACCOUNT/SYMBOLS INFO
This section contains information on the account and the current symbol.
8. Additional Indicators to be Used by the EA
The operation of the EA will require the use of the following indicators:
- SUBWINDOW indicator. It is not really an indicator but a dummy a subwindow where multiple charts will be displayed.
- Spy_Control_panel_MCM indicator. This indicator was developed by Konstantin Gruzdev (Lizar). More information on it can be found in the Code Base. It is used in the EA to get the following events: tick and new bar.
- MultiSignals_PCH indicator. This indicator was described at the beginning of the article. It can also be downloaded from the Code Base or from the list of files attached at the end of the article.
All indicators should be placed in the directory \MetaTrader 5\MQL5\Indicators.
Conclusion
So, here we get a quite multi-functional yet compact trader's kit.
Of course, you should keep in mind that there are different force majeure events that can hinder trading but the majority, if not all of them, can be avoided if you focus on medium- and long-term trading, or, at least, day trading excluding intra-hour trading (true for the EA featured in the article). It is important to understand that this is not a magic wand that will make you infinitely rich with no effort. You should learn to use it like any other tool and now you have everything you need in order to proceed.
There is a lot of ideas that will gradually be implemented in the future. The development of the program will continue further and support will be provided to the users who purchased it. Free updates to the program will also be available to the buyers of the product. Should you have any comments or suggestions regarding the product development, please feel free to contact me via e-mail specified in my profile or just PM me. Join the project and we will start down the trading road together!
Translated from Russian by MetaQuotes Ltd.
Original article: https://www.mql5.com/ru/articles/392
 OpenCL: From Naive Towards More Insightful Programming
 The Golden Rule of Traders
 Why Is MQL5 Market the Best Place for Selling Trading Strategies and Technical Indicators
 Visualize a Strategy in the MetaTrader 5 Tester
- Free trading apps
- Over 8,000 signals for copying
- Economic news for exploring financial markets
You agree to website policy and terms of use
Anatol, congratulations! You've done some serious work, keep it up!
Hi,
I faced the same issue. 403 Forbidden access.
May I know what is the solution for this error? Appreciate the help.
HI,
I downloaded your 3 files, but I'm a little confused. Are they indicators or is it missing the EA?
Only one of the files seems to show anything. the other two are just blank. I was interested in the Clock trading EA and the other ones on your article.
Please point me to the place where I can find them .. thanks
I have read the article, and I must say it is very interesting, I would also be interested in the BOOK REPORT excel sheet in the article it is said to come as an addendum to the EA but I have not found it, is it possible to download it?
Thank you